Introduction to Classical Chart Patterns
In the world of technical analysis, classical chart patterns play a pivotal role in forecasting the potential future direction of price movement. These patterns are formed by the geometric shapes created by connecting the highs and lows of price data points using trendlines or curves.
Understanding these patterns can provide traders and investors with valuable insights into market psychology and help in making informed trading decisions.
Key Concepts:
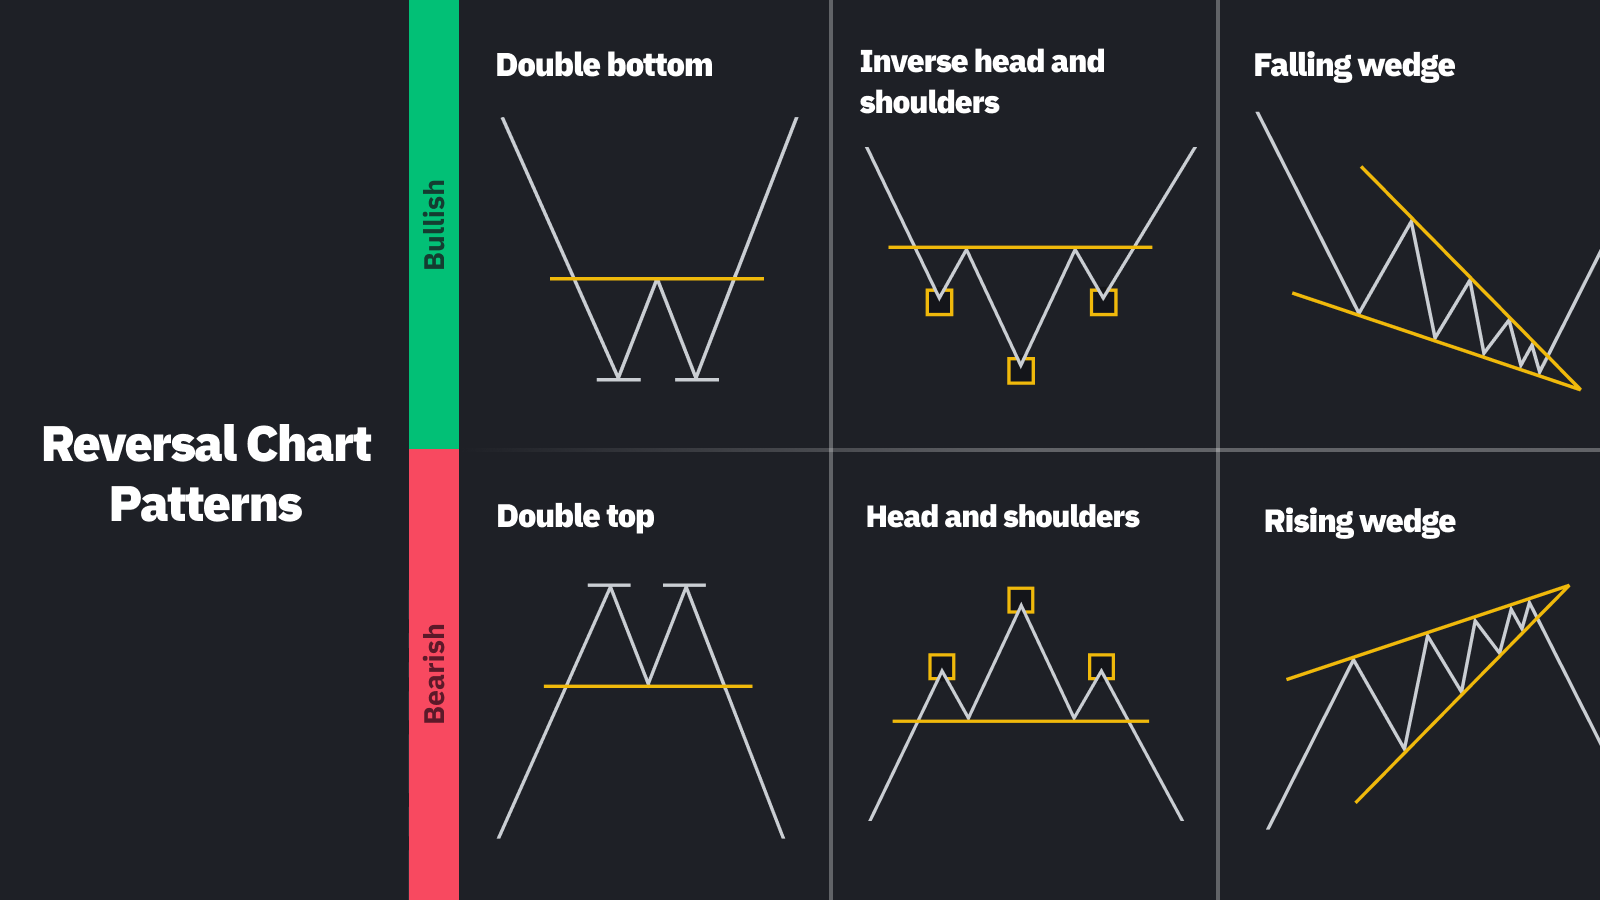
- Reversal Patterns: Signal a change in the existing trend.
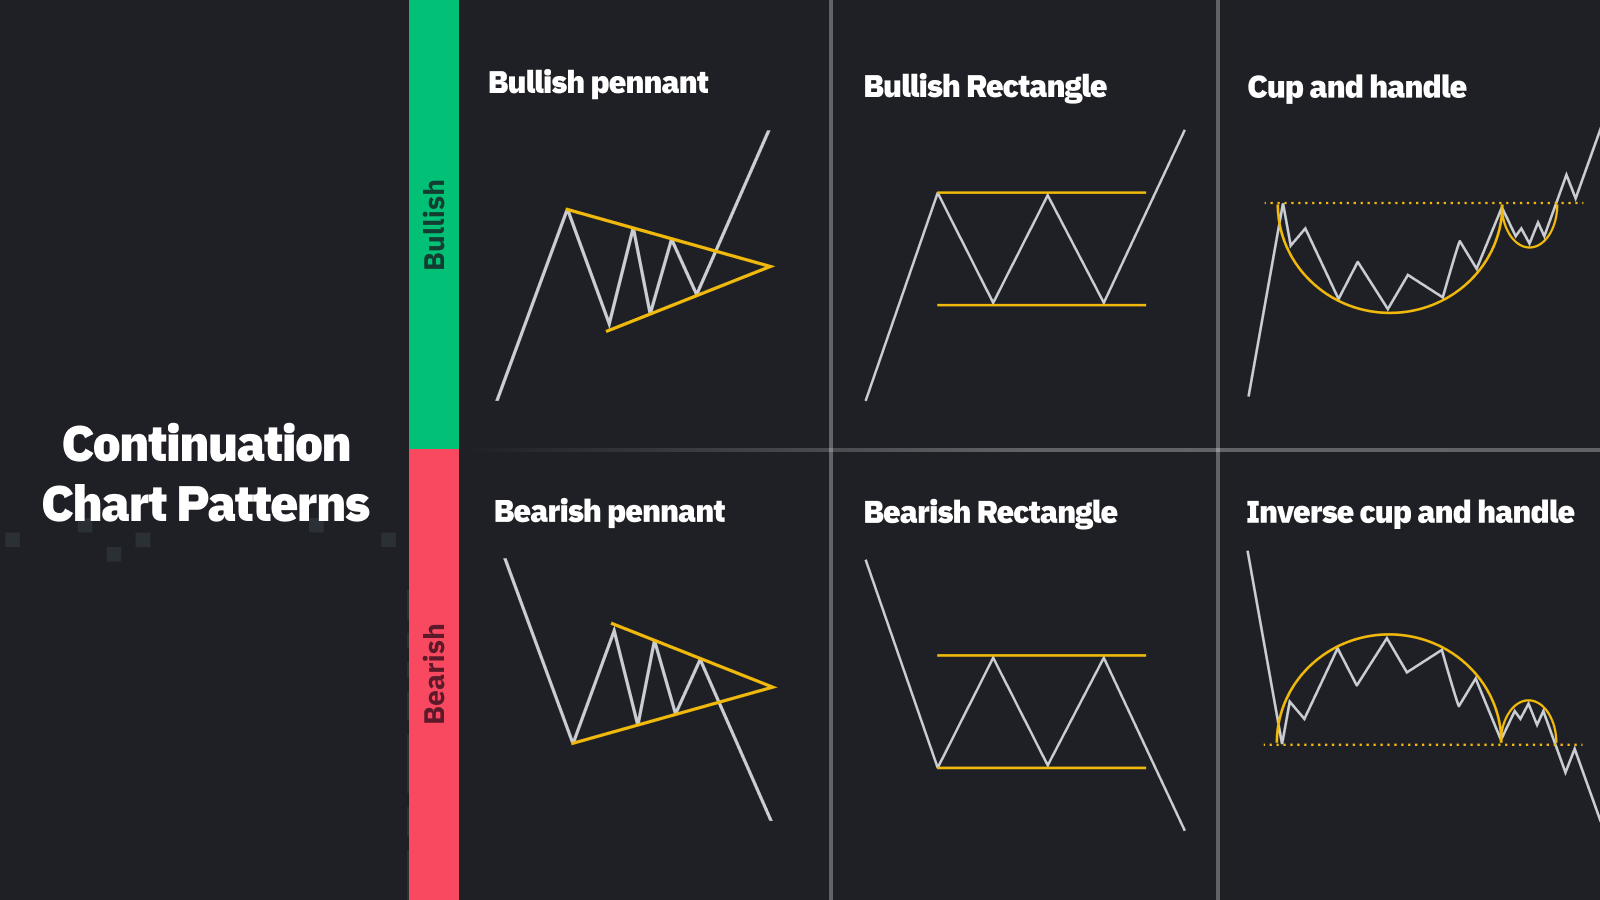
- Continuation Patterns: Indicate a temporary pause in the trend, followed by a resumption in the same direction.
- Trendlines: Essential in identifying patterns, representing levels of support and resistance.
Trendlines in Technical Analysis: The Building Blocks
Trendlines are fundamental in understanding price patterns. They are straight lines drawn by connecting descending peaks (highs) or ascending troughs (lows).
Types of Trendlines:
- Up Trendline: Formed by connecting ascending lows, indicating higher highs and higher lows.
- Down Trendline: Formed by connecting descending highs, showing lower highs and lower lows.
- Horizontal Trendline: Represents a consolidation phase where the price moves sideways.
Drawing Trendlines:
- Using Candle Bodies: Often provides a more accurate representation, especially on intraday charts.
- Using Closing Prices: Common on daily charts, reflecting the consensus of value for the day.
- Validity: Trendlines with three or more points are generally considered more valid.
Learn more about using trendlines.
Continuation Patterns: Pausing Before Resuming
Continuation patterns signify a temporary halt in a prevailing trend, providing a breather before the trend continues.
Common Continuation Patterns:
- Pennants: Formed by two converging trendlines, resembling a small symmetrical triangle.
- Flags: Constructed with two parallel trendlines, representing a short-term consolidation.
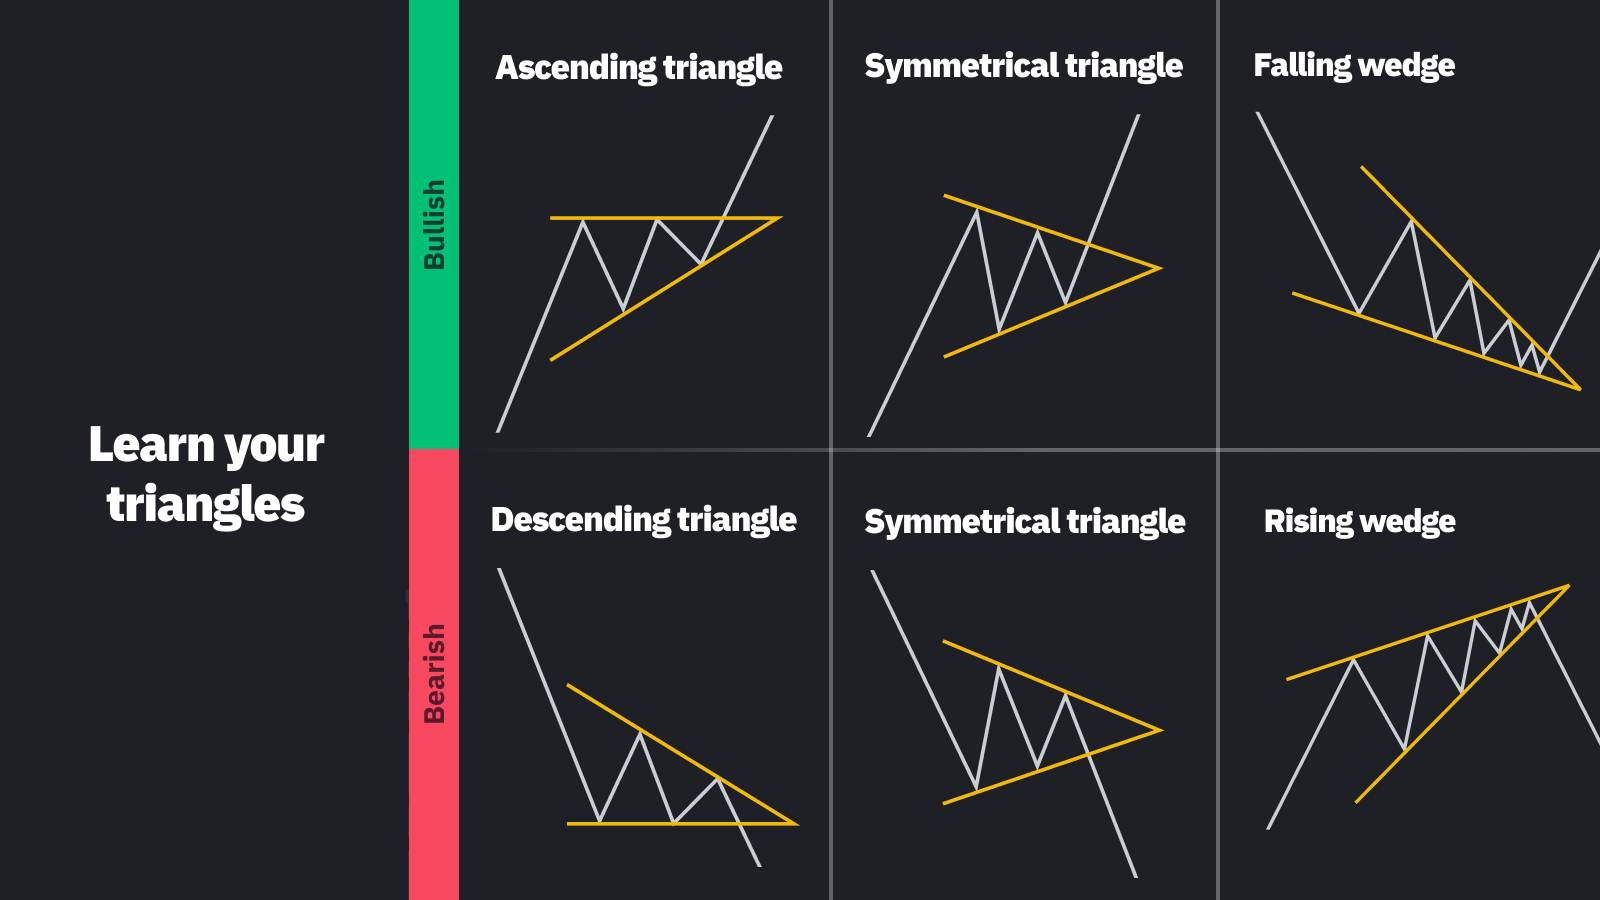
- Triangles: Including symmetrical, ascending, and descending triangles, each with unique characteristics.
- Cup and Handles: A bullish pattern resembling a tea cup, indicating a potential upward continuation.


Interpretation:
- Duration: The longer the pattern, the more significant the subsequent move.
- Confirmation: Wait for a breakout from the pattern to confirm the continuation.
Reversal Patterns: Changing Course
Reversal patterns indicate a potential change in the prevailing trend, marking the exhaustion of the current momentum.
Types of Reversal Patterns:
- Wedges: Formed by two converging trendlines, signaling a potential reversal.
- Head and Shoulders: A classic pattern indicating a potential top reversal.
- Double Tops & Bottoms: Representing failed attempts to break resistance or support levels.
- Rounding Tops & Bottoms: Gradual reversals forming a curve shape.

Market Phases:
- Distribution Patterns: Reversals at market tops, indicating selling pressure.
- Accumulation Patterns: Reversals at market bottoms, indicating buying interest.
Importance:
- Timing: Helps in identifying potential entry and exit points.
- Risk Management: Assists in setting stop-loss and take-profit levels.
Most Reliable Chart Patterns: A Research Perspective
Based on extensive research at AlgoStorm.com, certain patterns have been identified as more reliable:
- Ascending & Descending Triangles: Often lead to predictable breakouts.
- Bull & Bear Flags: Provide clear continuation signals.
- Rounding Tops & Bottoms: Gradual reversals that can be easier to spot.
- Double Tops and Bottoms With Regular Divergences: Highlight potential reversals with added confirmation through divergence.
Note on Divergence:
Divergence occurs when the price of an asset moves in the opposite direction of a technical indicator. It may signal a weakening trend and a potential change in direction.
Conclusion: The Symphony of Patterns
Classical chart patterns are like the notes in a symphony, each playing a unique role in the composition of the market’s story. By understanding these patterns, traders can interpret the market’s rhythm, anticipate its next move, and execute trades with greater confidence.
However, it’s essential to remember that no pattern is foolproof. Combining chart patterns with other forms of technical analysis, such as indicators and volume analysis, can provide a more holistic view of the market.
Always practice prudent risk management and consult with financial professionals when necessary.