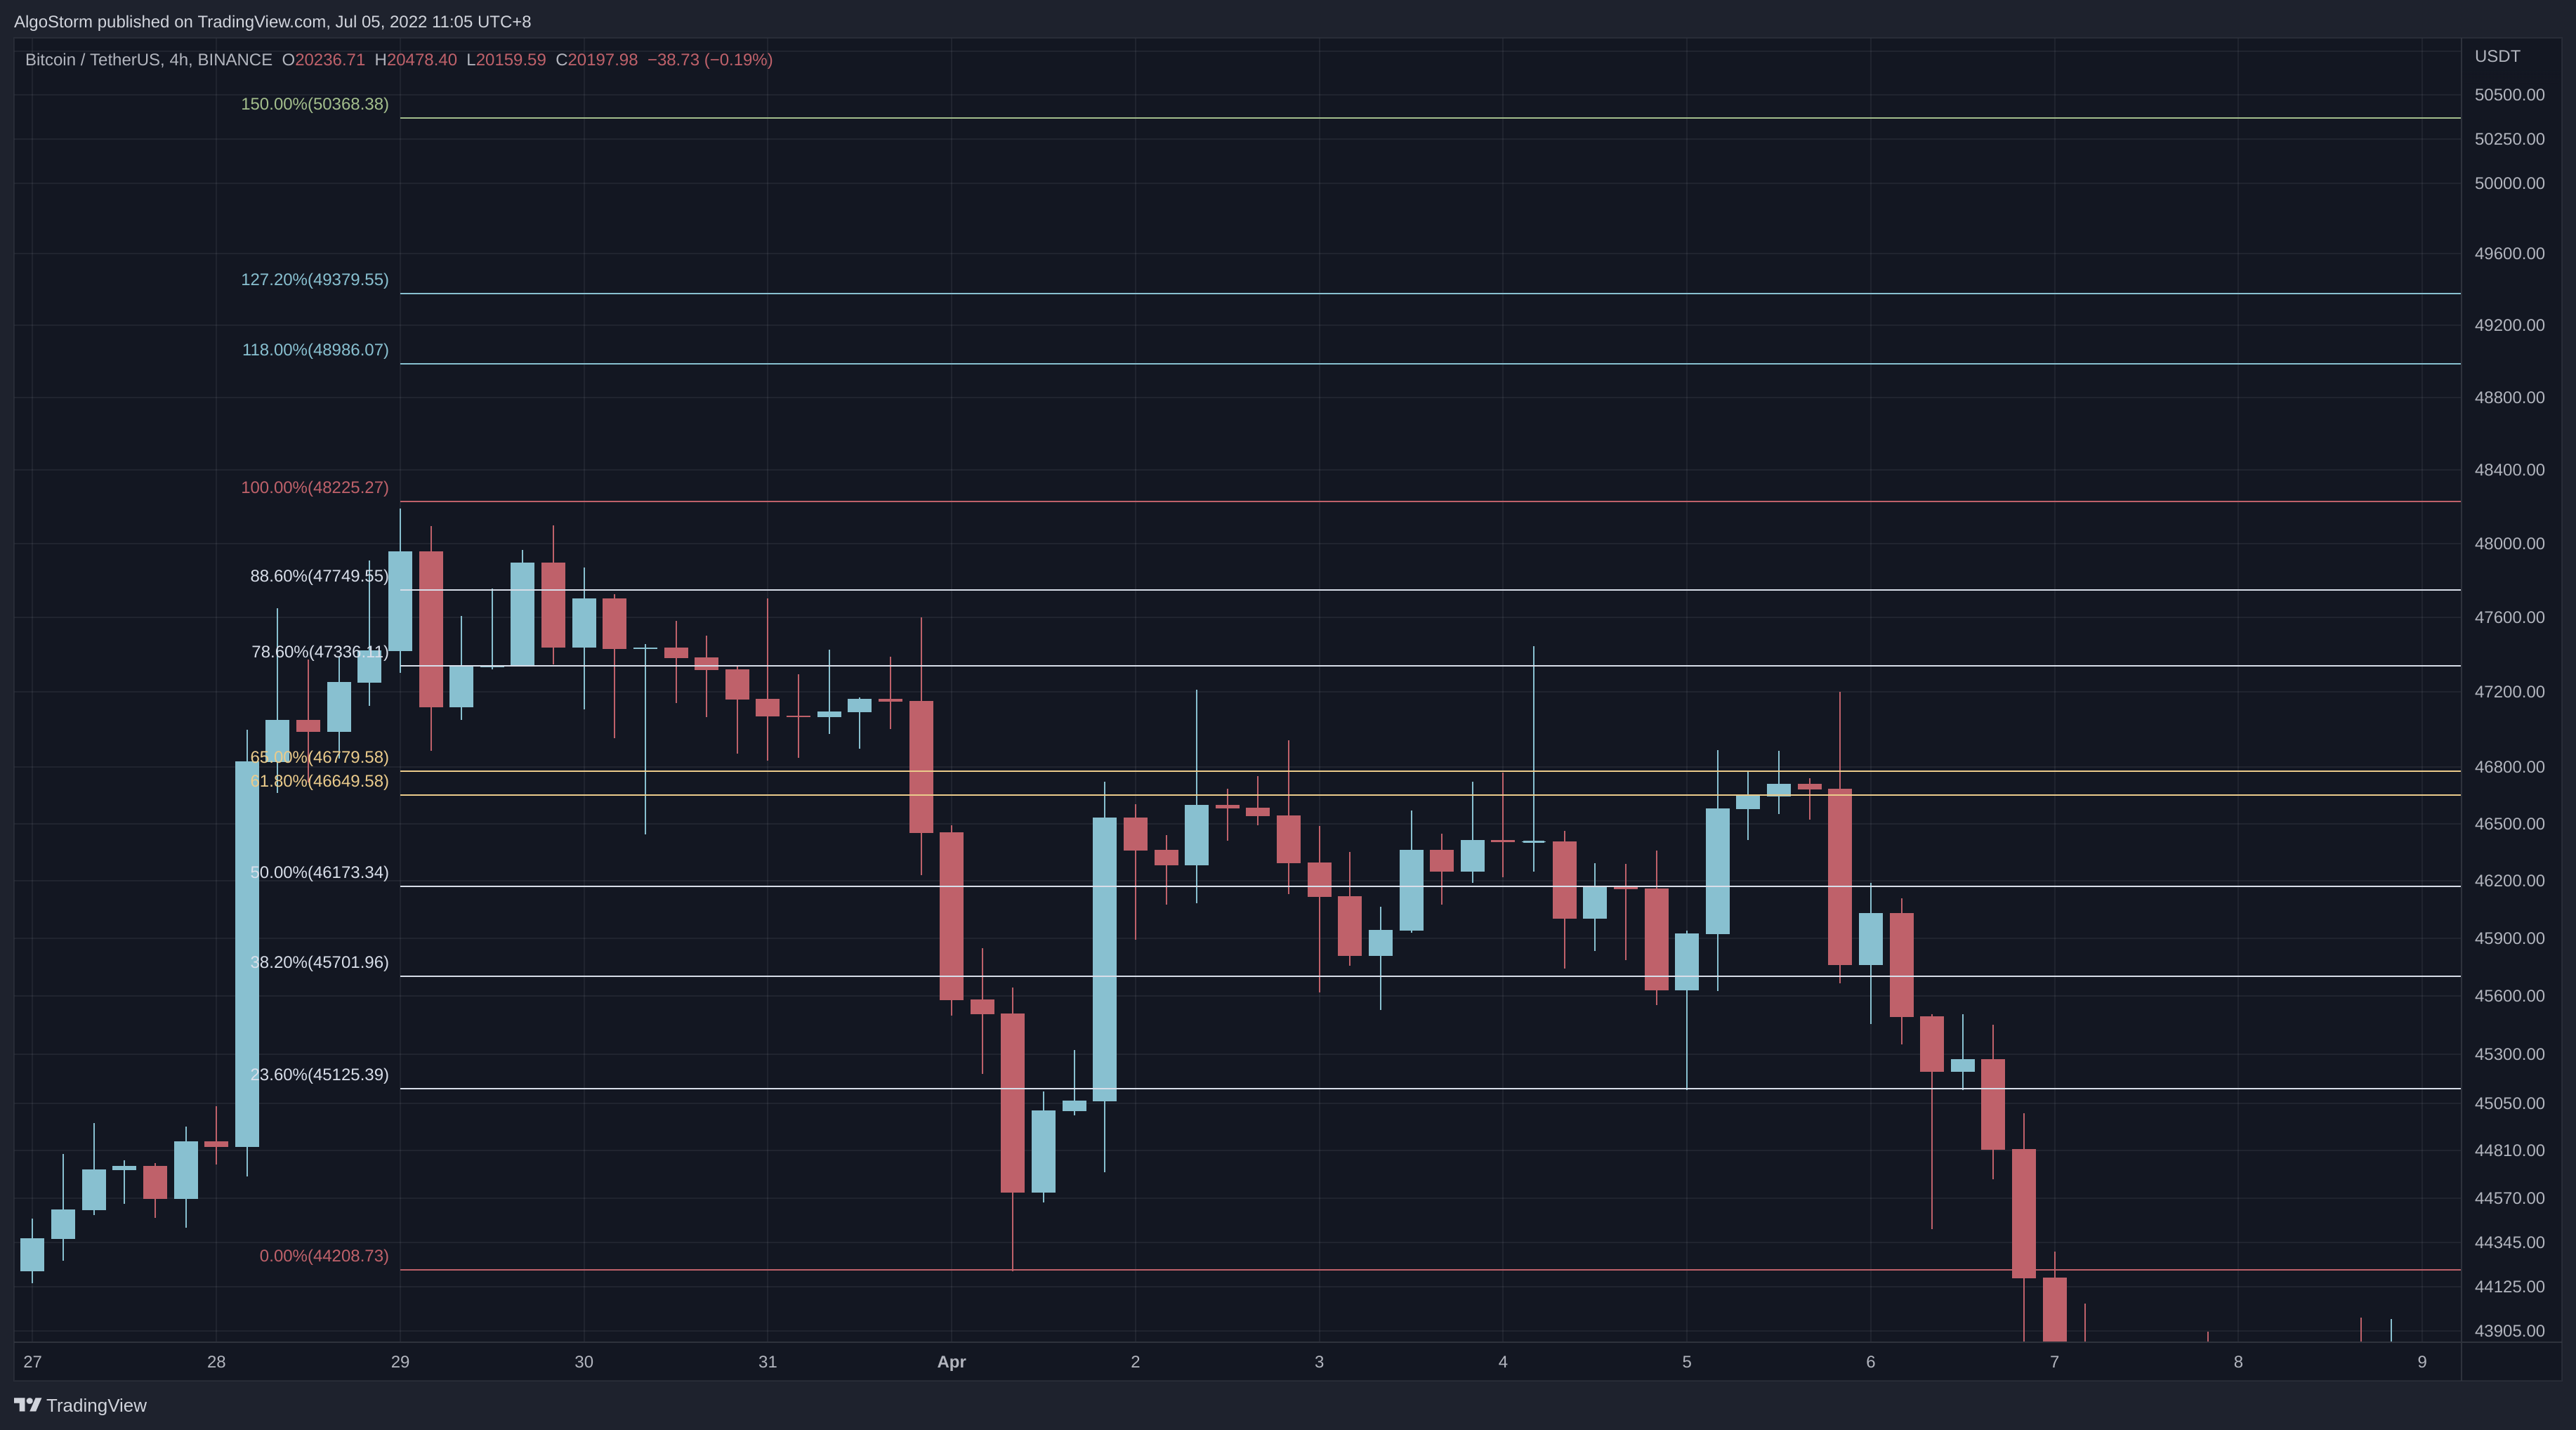
Fibonacci Retracement Levels Definition
Fibonacci retracement levels, rooted in the famous Fibonacci sequence, are a set of horizontal lines that signify potential support and resistance points in the trading world. These levels are widely used by traders to predict where a price might find support or resistance, and they are based on key percentages derived from the Fibonacci sequence.
The Fibonacci Sequence and Its Relevance
The Fibonacci sequence starts with 0 and 1, and each subsequent number is the sum of the two preceding ones. The sequence looks like this:
0, 1, 1, 2, 3, 5, 8, 13, 21, 34, 55, 89, 144, 233, 377, 610, 987, 1597, 2584, 4181… and continues indefinitely.
The Fibonacci retracement levels are 23.6%, 38.2%, 61.8%, and 78.6%. Additionally, the 50% level, although not an official Fibonacci ratio, is commonly used in trading.
These percentages represent how much of a prior move the price has retraced, and they are derived from mathematical calculations involving the Fibonacci sequence.
Historical Background
Fibonacci retracement levels were named after the Italian mathematician Leonardo Pisano Bigollo, famously known as Leonardo Fibonacci. However, it’s essential to note that Fibonacci did not create the sequence. He introduced these numbers to Western Europe after learning about them from Indian merchants. The origins of the Fibonacci sequence can be traced back to Ancient India, between 450 and 200 BCE.

Important Points To Remember
- Versatility: The levels can be drawn between any two significant price points, such as a high and a low, making them highly adaptable to different market conditions.
- Potential Reversal Zones: The percentage levels provided are areas where the price could stall or reverse, but they should not be relied upon exclusively.
- Common Ratios: The most commonly used ratios include 23.6%, 38.2%, 50%, 61.8%, and 78.6%.
- Historical Roots: Fibonacci numbers and sequencing were first used by Indian mathematicians centuries before Leonardo Fibonacci.
Numbers First Formulated in Ancient India:
The Fibonacci sequence’s roots lie in India, where mathematician Acarya Virahanka developed the numbers and their sequencing around 600 AD. Subsequent generations of Indian mathematicians, including Gopala, Hemacandra, and Narayana Pandita, expanded its use. It is estimated that Fibonacci numbers existed in Indian society as early as 200 AD.
The Formula for Fibonacci Retracement Levels
Interestingly, Fibonacci retracement levels do not have specific formulas. When applied to a chart, the user chooses two points, and the lines are drawn at percentages of that move. This simplicity makes them accessible to traders at all levels.
Fibonacci Retracement Levels Calculation
The origin of the Fibonacci numbers is tied to the Golden Ratio, a mathematical constant often denoted by 0.618 or 1.618. This ratio is found in various natural phenomena, from sunflowers and galaxy formations to shells and human DNA.
Using Fibonacci Retracement Levels
Fibonacci retracements can be employed in various ways:
- Entry Orders: Identifying potential entry points in the market.
- Stop-Loss Levels: Determining levels to limit potential losses.
- Price Targets: Setting targets for taking profits.
- Combination with Other Tools: Enhancing accuracy by using them with other technical analysis tools like Gartley patterns and Elliott Wave theory.
Limitations Of Fibonacci Retracement Levels
While powerful, Fibonacci retracement levels are not without limitations:
- No Guarantees: There are no assurances that the price will actually stop at a specific level.
- Overabundance of Levels: The multitude of levels can lead to confusion about which one will be relevant at any given time.
Fibonacci Retracement Mistakes To Avoid
- Don’t Mix Reference Points: Consistency in referencing points is crucial for accurate analysis.
- Don’t Ignore Long-Term Trends: Keeping the bigger picture in mind helps in applying retracements in the correct direction.
- Don’t Rely on Fibonacci Alone: Combining with other technical tools like MACD or stochastic oscillators increases reliability.
- Avoid Using Fibonacci for Short-Term: In highly volatile short-term trading, retracement levels may be less reliable.
Conclusion
Fibonacci retracement levels offer valuable insights into potential price movements, but they should be used with caution and in conjunction with other tools. Understanding their historical background, mathematical basis, and practical applications can enhance trading strategies and decision-making. Like all tools in the financial markets, they are not foolproof and should be used with a clear understanding of their limitations and potential pitfalls.