Introduction to Technical Indicators
Technical indicators are essential tools in the world of trading and investment. They provide insights into the market’s behavior, helping traders make informed decisions. This comprehensive guide will explore what technical indicators are, how they work, their types, and common mistakes to avoid.
What Are Technical Indicators?
Technical indicators are heuristic or pattern-based signals generated by the price, volume, and/or open interest of a security or contract. Traders who follow technical analysis use these indicators to make predictions about future price movements.
Definition and Importance
Technical indicators are mathematical calculations based on the price, volume, or open interest of a security or contract. They serve as valuable tools for traders who follow technical analysis, helping them judge entry and exit points for trades.
At AlgoStorm.com, we offer premium, expertly crafted technical indicators to simplify trading and guide investors towards consistent profitability.
Key Points to Remember:
- Technical indicators are heuristic or mathematical calculations.
- They help in predicting future price movements by analyzing historical data.
- Technical indicators fall into two main categories: overlays and oscillators.
How Technical Indicators Work?
Technical analysis is a trading discipline that evaluates investments by analyzing statistical trends from trading activity, such as price movement and volume.
Comparison with Fundamental Analysis
Unlike fundamental analysts, who evaluate a security’s intrinsic value based on financial or economic data, technical analysts focus on patterns of price movements and various analytical charting tools.
Application Across Various Securities
Technical analysis can be applied to stocks, futures, commodities, fixed-income, currencies, and other securities. It’s focused on historical trading data rather than business fundamentals.
Usage by Different Types of Traders
While commonly used by active traders for short-term price movements, long-term investors may also utilize technical indicators to identify entry and exit points.
Types of Technical Indicators
Technical indicators are broadly classified into two categories:
Overlays
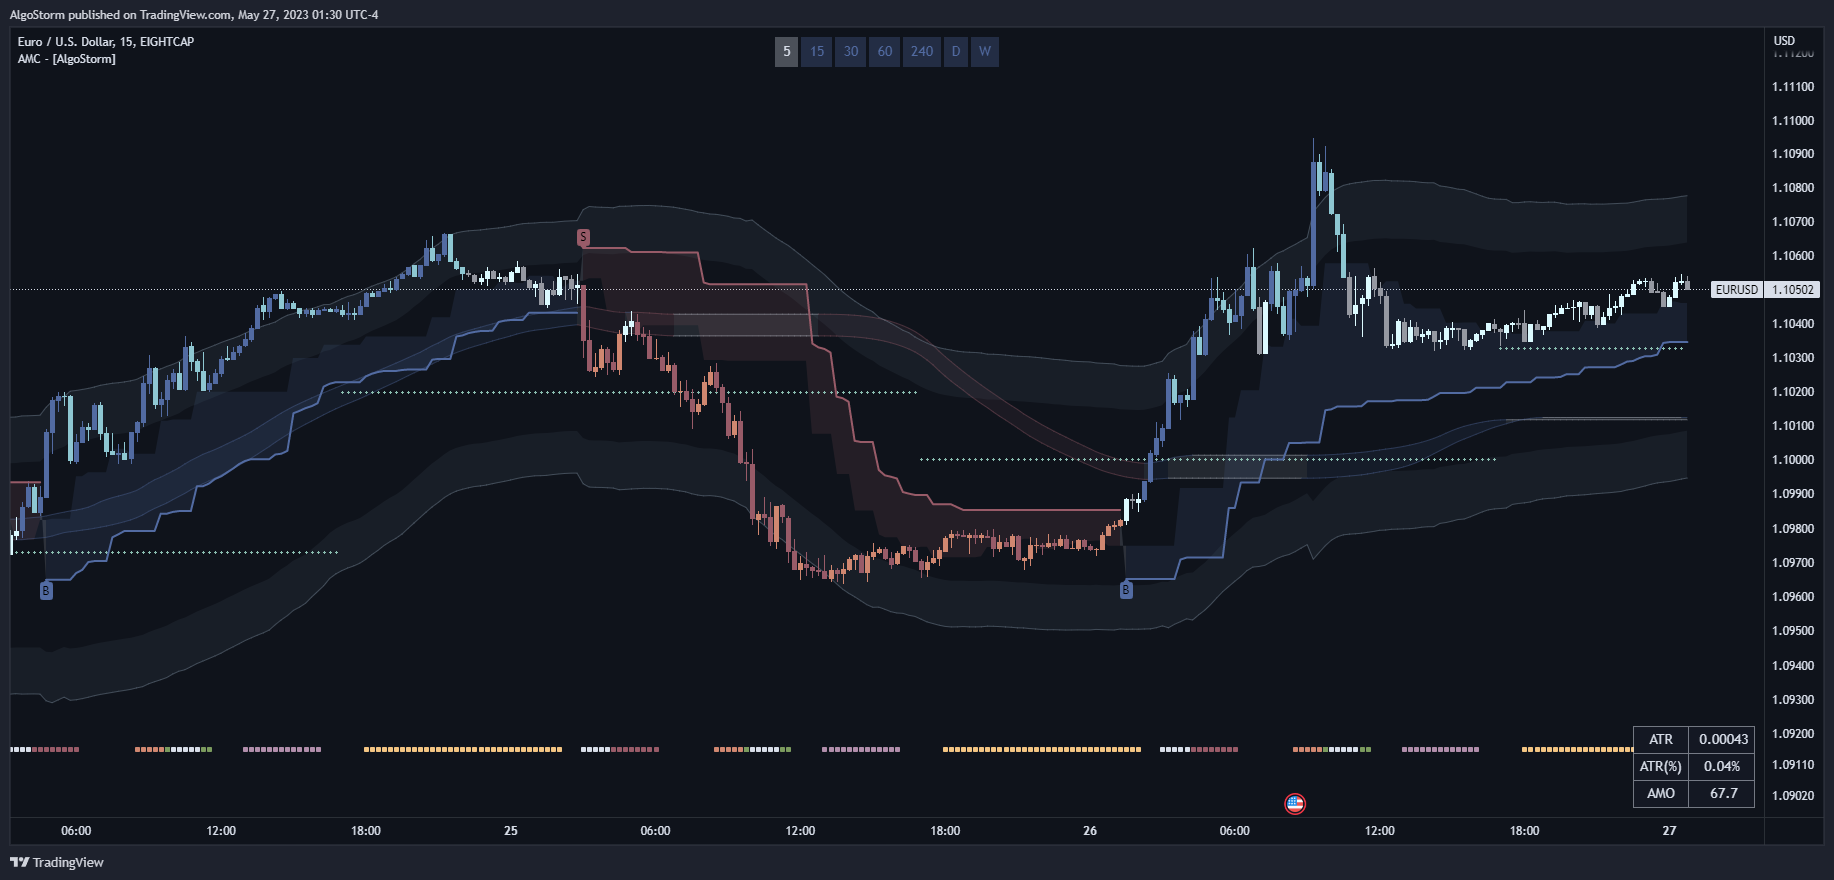
These are plotted over the prices on a stock chart, using the same scale as prices. Examples include moving averages and Bollinger Bands®.
Oscillators
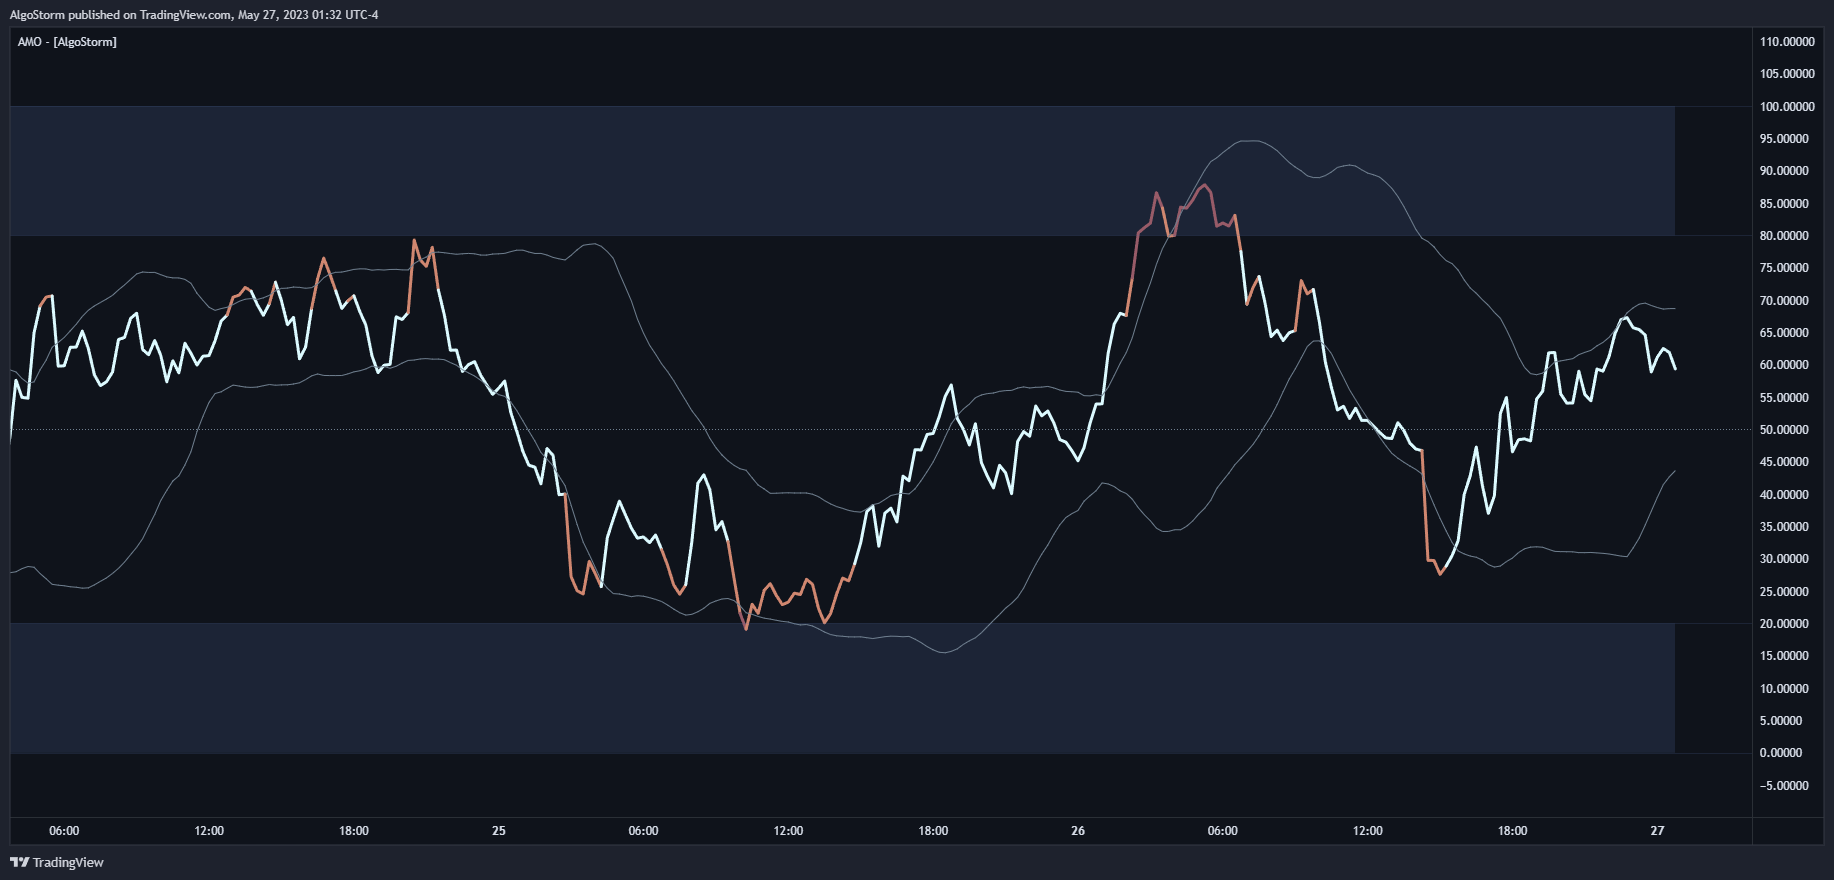
These oscillate between a local minimum and maximum and are plotted above or below a price chart. Examples include the stochastic oscillator, MACD, or RSI.
Traders often combine different technical indicators and may also incorporate them into automated trading systems.
Groups Of Technical Indicators
Technical indicators can be divided into 4 unique groups: trending, volatility, momentum, and volume indicators. Special groups focus on order books and on-chain related indicators in Cryptocurrency trading.
Trend Indicators
These indicators identify and follow trends to predict reversals or ranges. Examples include Moving Averages, SuperTrend, Parabolic SAR, and Ichimoku Kinkō Hyō.
Momentum Indicators
Momentum indicators measure the speed and strength of price movement. Common examples include Average Directional Index (ADX), MACD, RSI, and Stochastic Oscillator.
Volatility Indicators
These indicators measure price volatility, indicating market conditions. Common examples include Average True Range (ATR), Bollinger Bands (BB), and Keltner Channel.
Volume Indicators
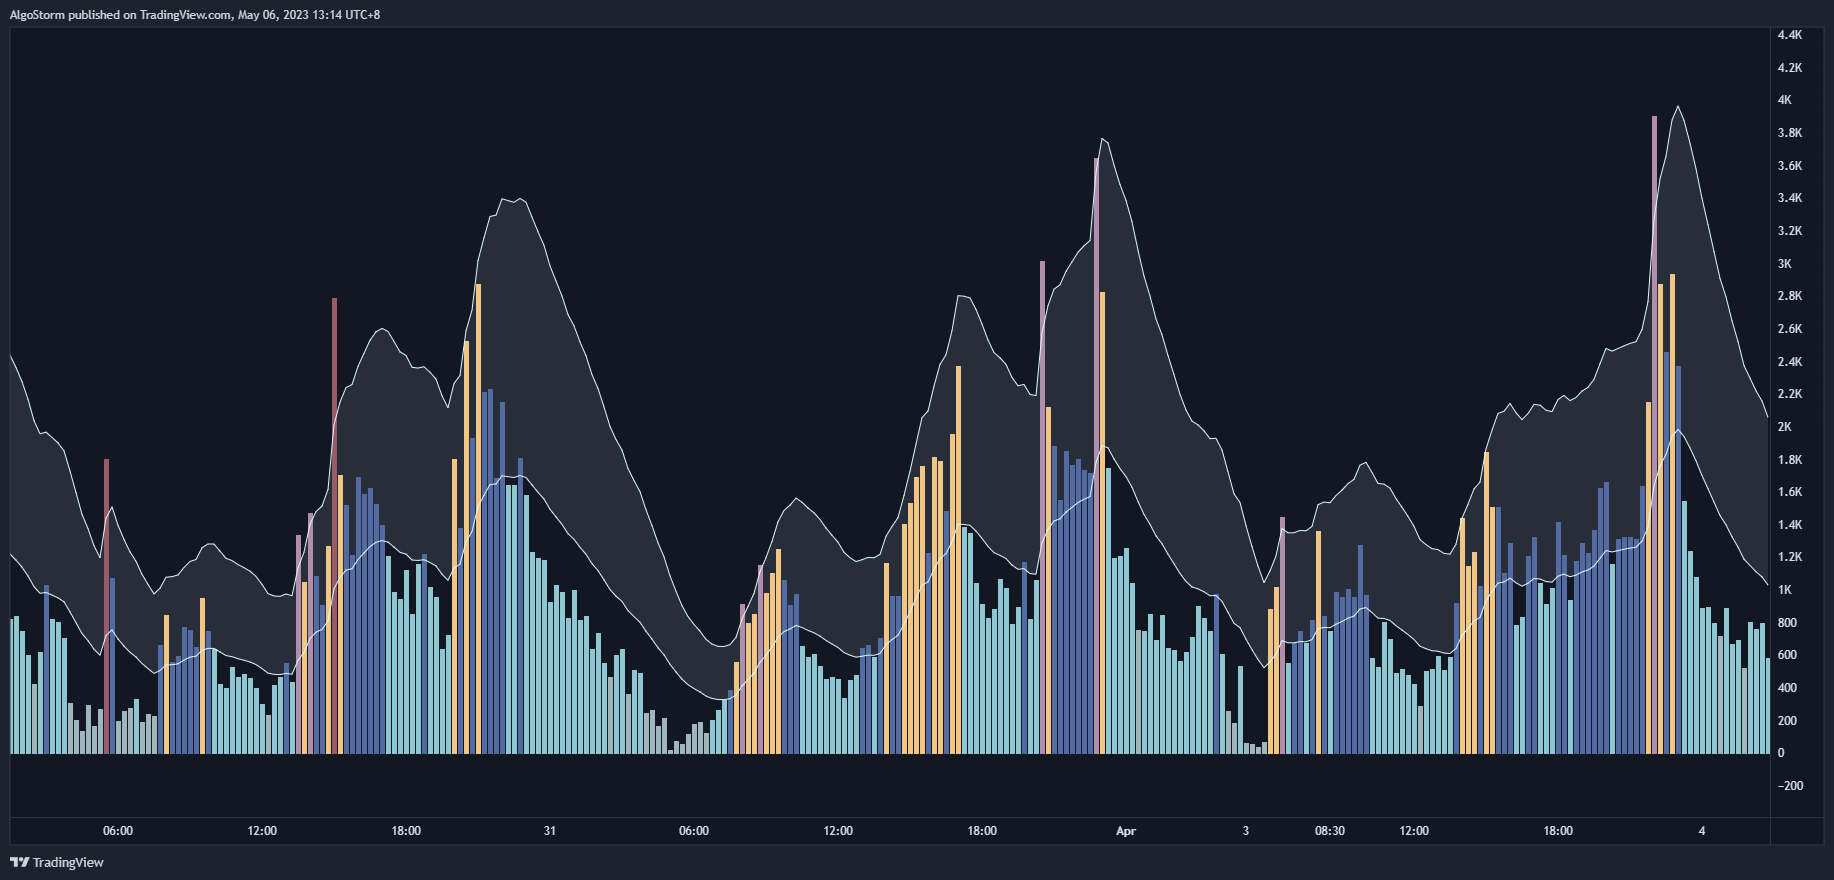
Volume indicators measure the number of contracts traded, helping to gauge the strength and direction of a trend. Examples include Chaikin Money Flow (CMF), Volume Profile, and Volume Weighted Average Price (VWAP).
Order Book & Depth Of Market (DOM)
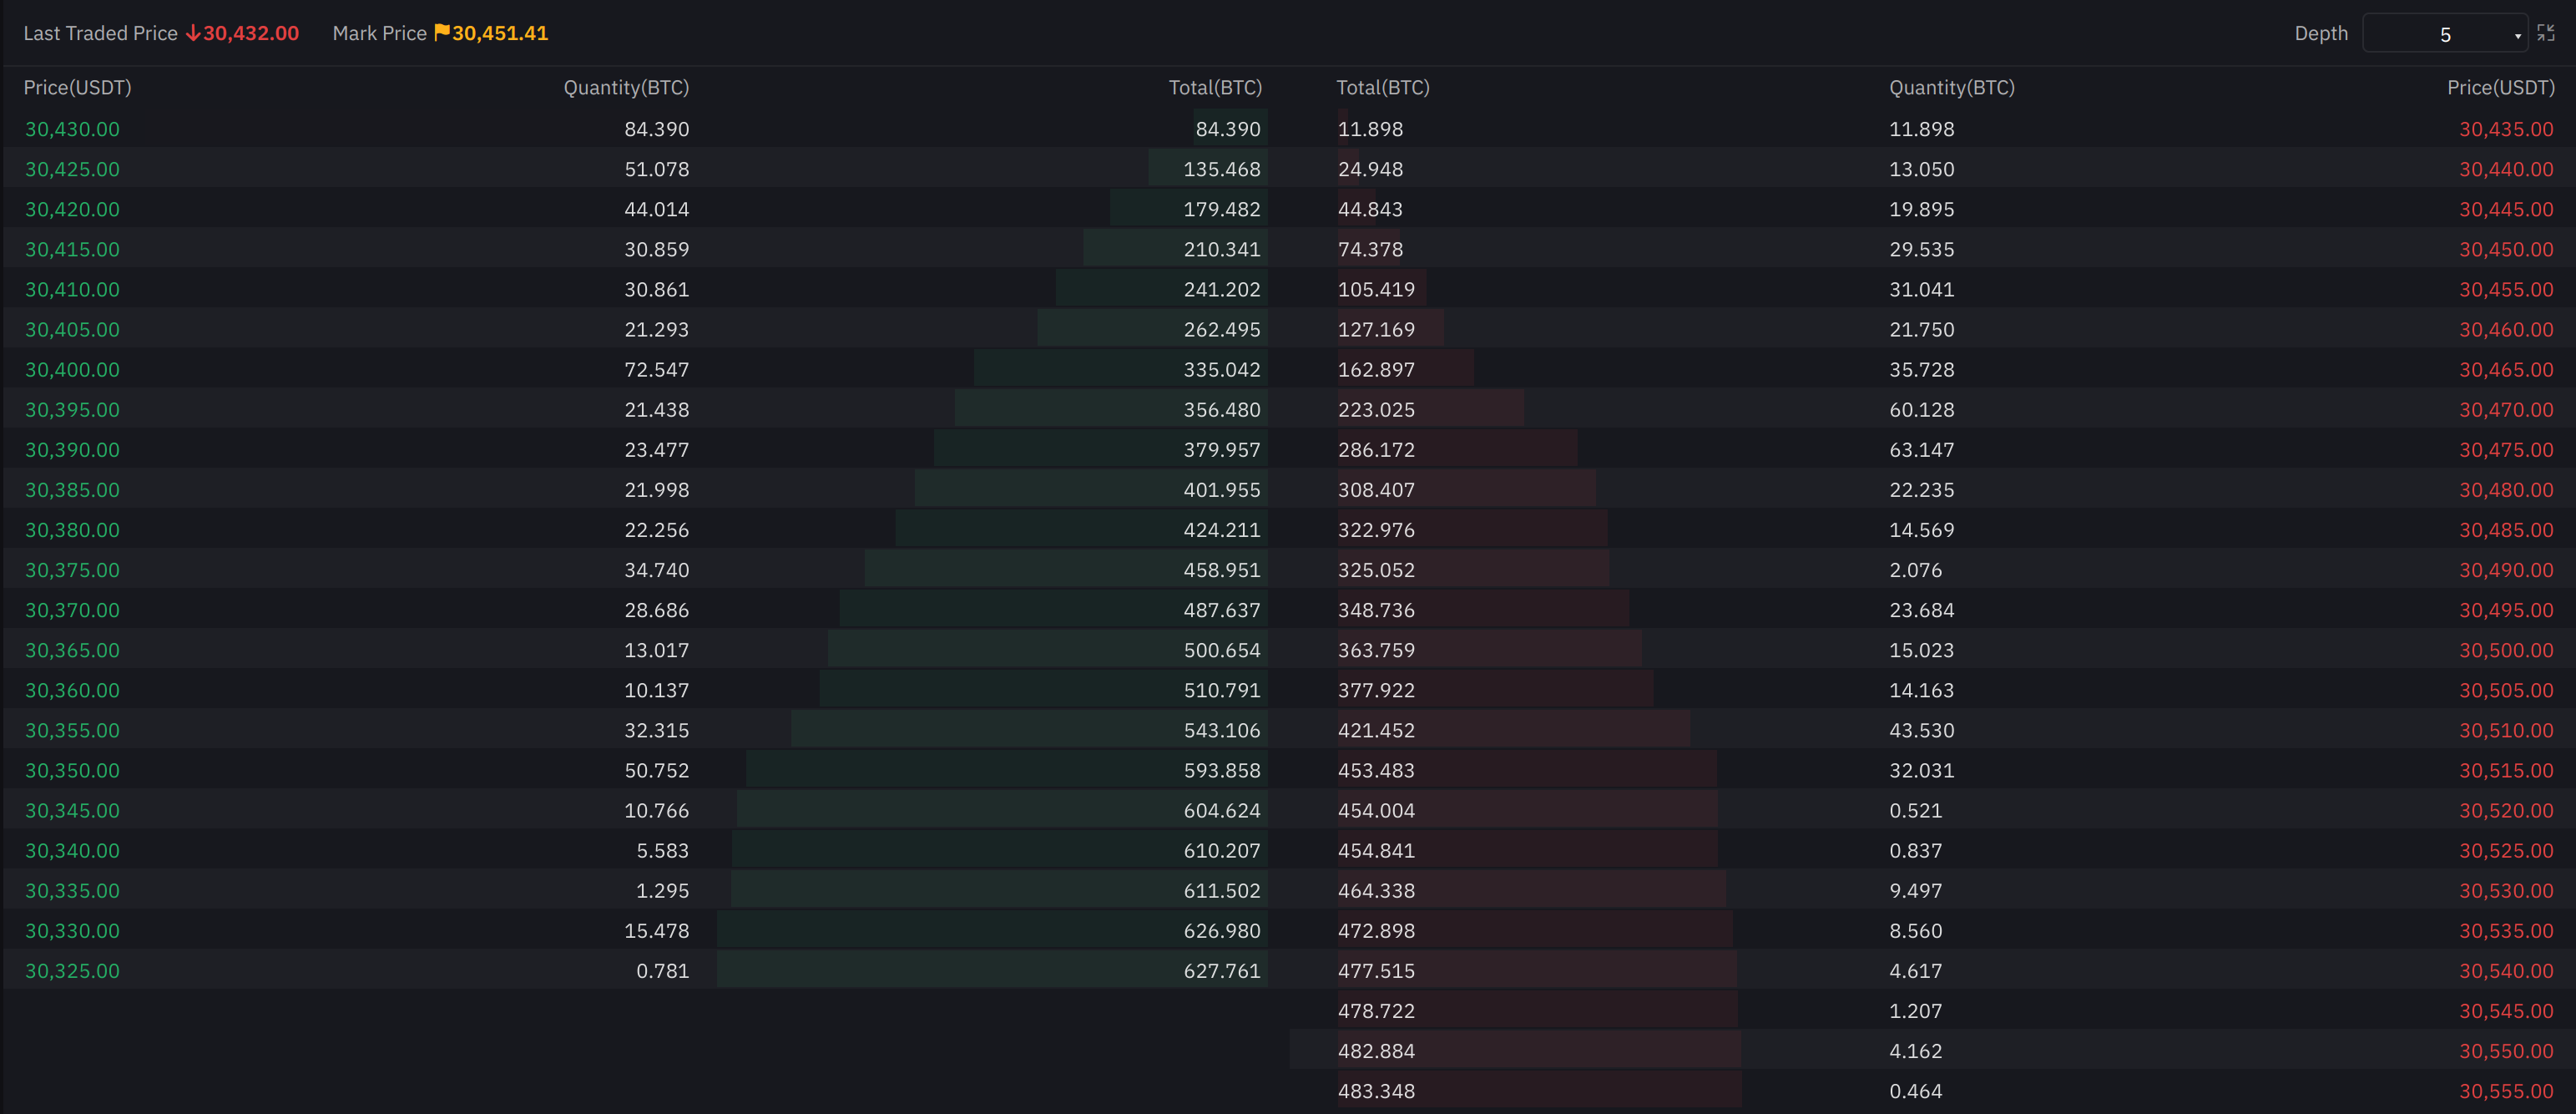
Depth of market (DOM) is a measure of supply and demand for liquid, tradeable assets. It’s based on the number of open buy and sell orders and is also known as the order book.
On-Chain Metrics
On-chain metrics include information of all transactions on a Blockchain network. It’s a crucial aspect of Cryptocurrency trading, providing insights into transaction data, block data, and smart contract code.
Common Mistakes When Using Indicators
Avoiding common mistakes can enhance the effectiveness of technical indicators. Here are some pitfalls to avoid:
Mistake 1 – Using too Many Indicators
Simplicity is key. Using too many indicators can lead to information overload and conflicting signals.
Mistake 2 – Relying On A Single Indicator
No single indicator provides a foolproof path to success. Confirming signals with another indicator using different calculations can prevent errors.
Mistake 3 – Using Indicators Without Backtesting
Backtesting or forward-testing is essential to validate the effectiveness of a strategy.
Mistake 4 – Not Analyzing The Overall Market Trend
Understanding the overall market trend and the strengths and weaknesses of your indicator is vital. Analyzing the market structure on various timeframes helps in understanding the overall direction.
Conclusion
Technical indicators are indispensable tools for traders and investors. Understanding their types, applications, and common mistakes can significantly enhance trading strategies. At AlgoStorm.com, we provide premium technical indicators to guide you in becoming consistently profitable. Explore our offerings and empower your trading journey.


