What Are Support & Resistance Lines?
The concepts of trading level support and resistance are undoubtedly two of the most highly discussed attributes of technical analysis. As part of analyzing chart patterns, these terms are used by traders to refer to price levels on charts that tend to act as barriers, preventing the price of an asset from being pushed in a certain direction.
Important Points To Remember:
- Technical analysts use support and resistance levels to identify price points on a chart where the probabilities favor a pause or reversal of a prevailing trend.
- Support occurs where a downtrend is expected to pause due to a concentration of demand.
- Resistance occurs where an uptrend is expected to pause temporarily, due to a concentration of supply.
- Market psychology plays a major role, as traders and investors remember the past and react to changing conditions to anticipate future market movement.
- Support and resistance areas can be identified on charts using horizontal lines, trendlines, pitchforks, moving averages, and Fibonacci retracements.
- Support and resistance areas collect liquidity pools behind them. That means even when they hold without being broken, the price action may still briefly surpass them to collect the liquidity that lies behind them, which can be in the form of stop losses or limit orders. In other words, putting your stop loss directly behind them does not give your trade any protection.
- Always remember that the price action may or may not respect any zone. Do not build your trading plan solely on support and resistance areas. Only take them as a metric for confluence.
Definition Of Support & Resistance Zones
Support is a price level where a downtrend can be expected to pause due to a concentration of demand or buying interest. As the price of assets or securities drops, demand for the shares increases, thus forming the support line. Meanwhile, resistance zones arise due to selling interest when prices have increased.
Once an area or "zone" of support or resistance has been identified, those price levels can serve as potential entry or exit points because, as a price reaches a point of support or resistance, it will do one of two things—bounce back away from the support or resistance level, or violate the price level and continue in its direction—until it hits the next support or resistance level.
The timing of some trades is based on the belief that support and resistance zones will not be broken. Whether the price is halted by the support or resistance level, or it breaks through, traders can "bet" on the direction and can quickly determine if they are correct. If the price moves in the wrong direction, the position can be closed at a small loss. If the price moves in the right direction, however, the move may be substantial.
Horizontal Lines & Zones
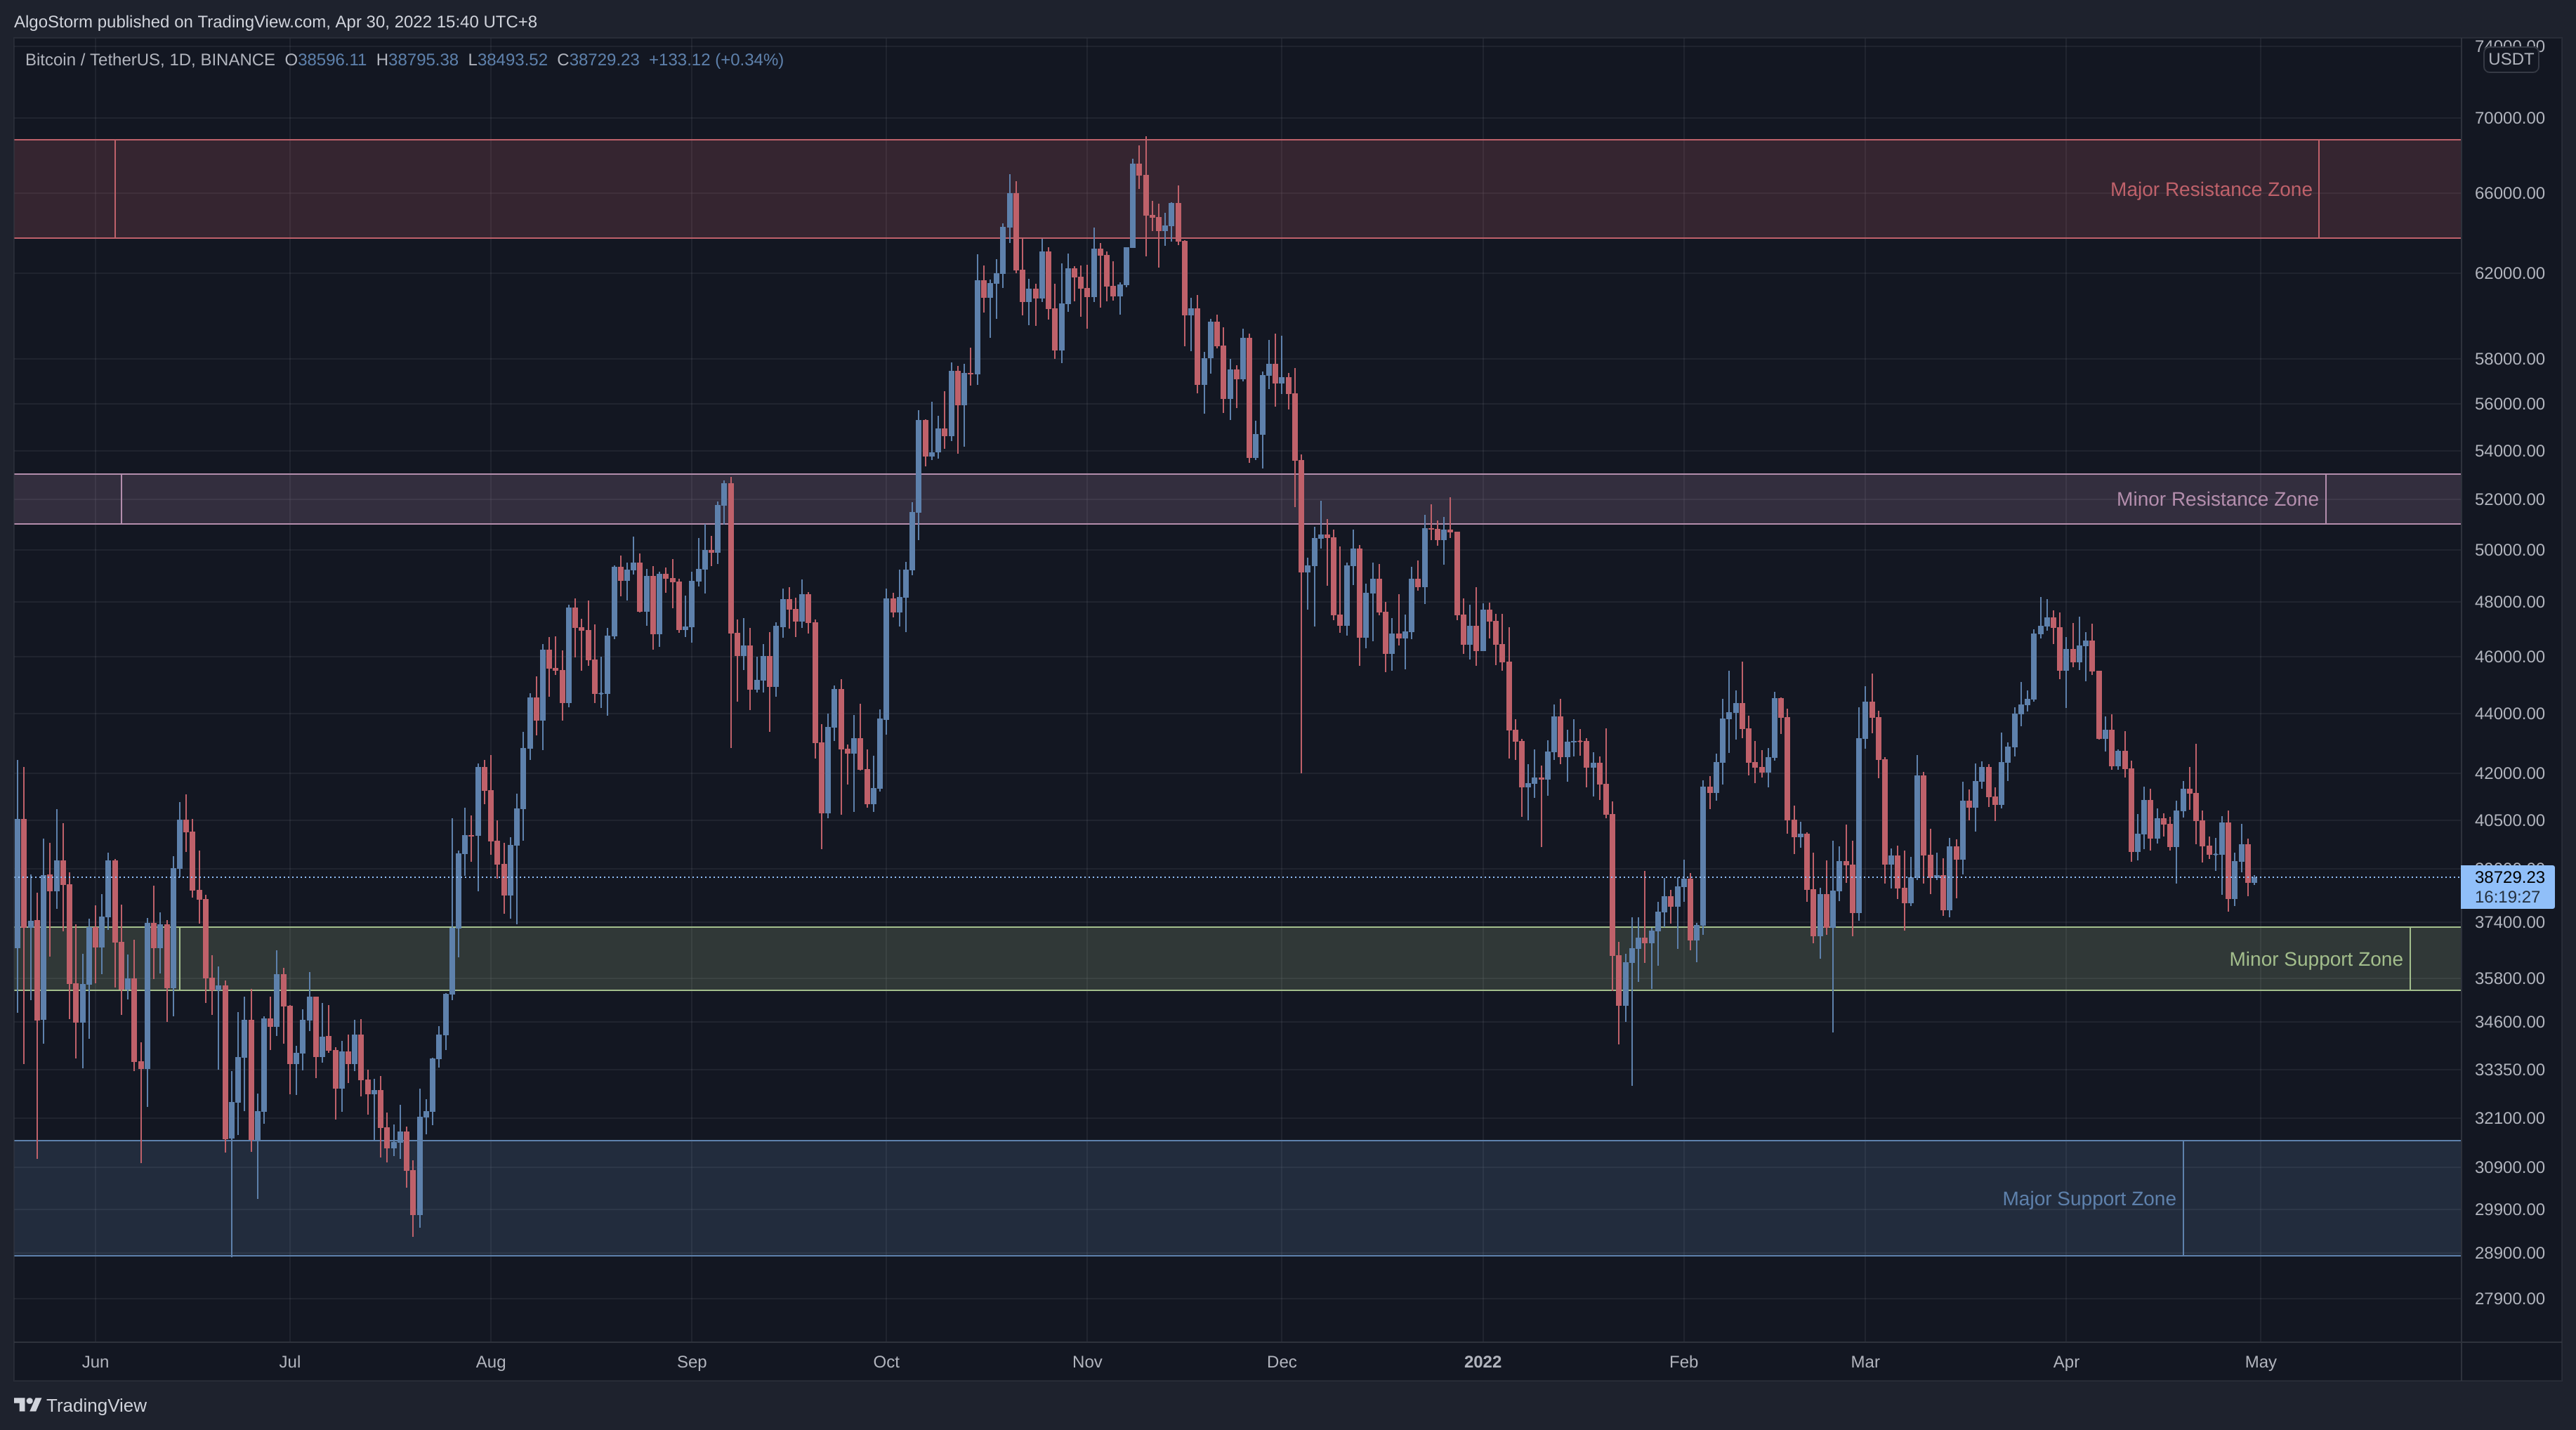
The first type of support and resistance zones are horizontal lines. These lines should be plotted on the high time-frames where there is a clear supply or demand.
Usually, we use the daily, weekly, and monthly time-frames to spot these horizontal lines. For day traders, they use the 4-hour time-frames as well to spot the right zones.
Illustration Of Horizontal Support & Resistance Lines:

Trendlines
The examples above show that a constant level prevents an asset’s price from moving higher or lower. This static barrier is one of the most popular forms of support/resistance, but the price of financial assets generally trends upward or downward, so it is not uncommon to see these price barriers change over time. This is why the concepts of trending and trendlines are important when learning about support and resistance.
When the market is trending to the upside, resistance levels are formed as the price action slows and starts to move back toward the trendline – (also called in this case the bullish trendline). This occurs as a result of profit-taking or near-term uncertainty for a particular issue or sector.
The resulting price action undergoes a "plateau" effect, or a slight drop-off in stock price, creating a short-term top.
On the other hand, when the market is trending to the downside, traders will watch for a series of declining peaks and will attempt to connect these peaks together with a trendline – (also called in this case the bearish trendline).
When the price approaches the trendline, most traders will watch for the asset to encounter selling pressure and may consider entering a short position because this is an area that has pushed the price downward in the past.
The support/resistance of an identified level, whether discovered with a trendline or through any other method, is deemed to be stronger the more times that the price has historically been unable to move beyond it. Many technical traders will use their identified support and resistance levels to choose strategic entry/exit points because these areas often represent the prices that are the most influential to an asset’s direction. Most traders are confident at these levels in the underlying value of the asset, so the volume generally increases more than usual, making it much more difficult for traders to continue driving the price higher or lower.
Unlike the rational economic actors portrayed by financial models, real human traders and investors are emotional, make cognitive errors, and fall back on heuristics or shortcuts. If people were rational, support and resistance levels wouldn’t work in practice!
Andrews’ Pitchforks
What Is Andrews’ Pitchfork?
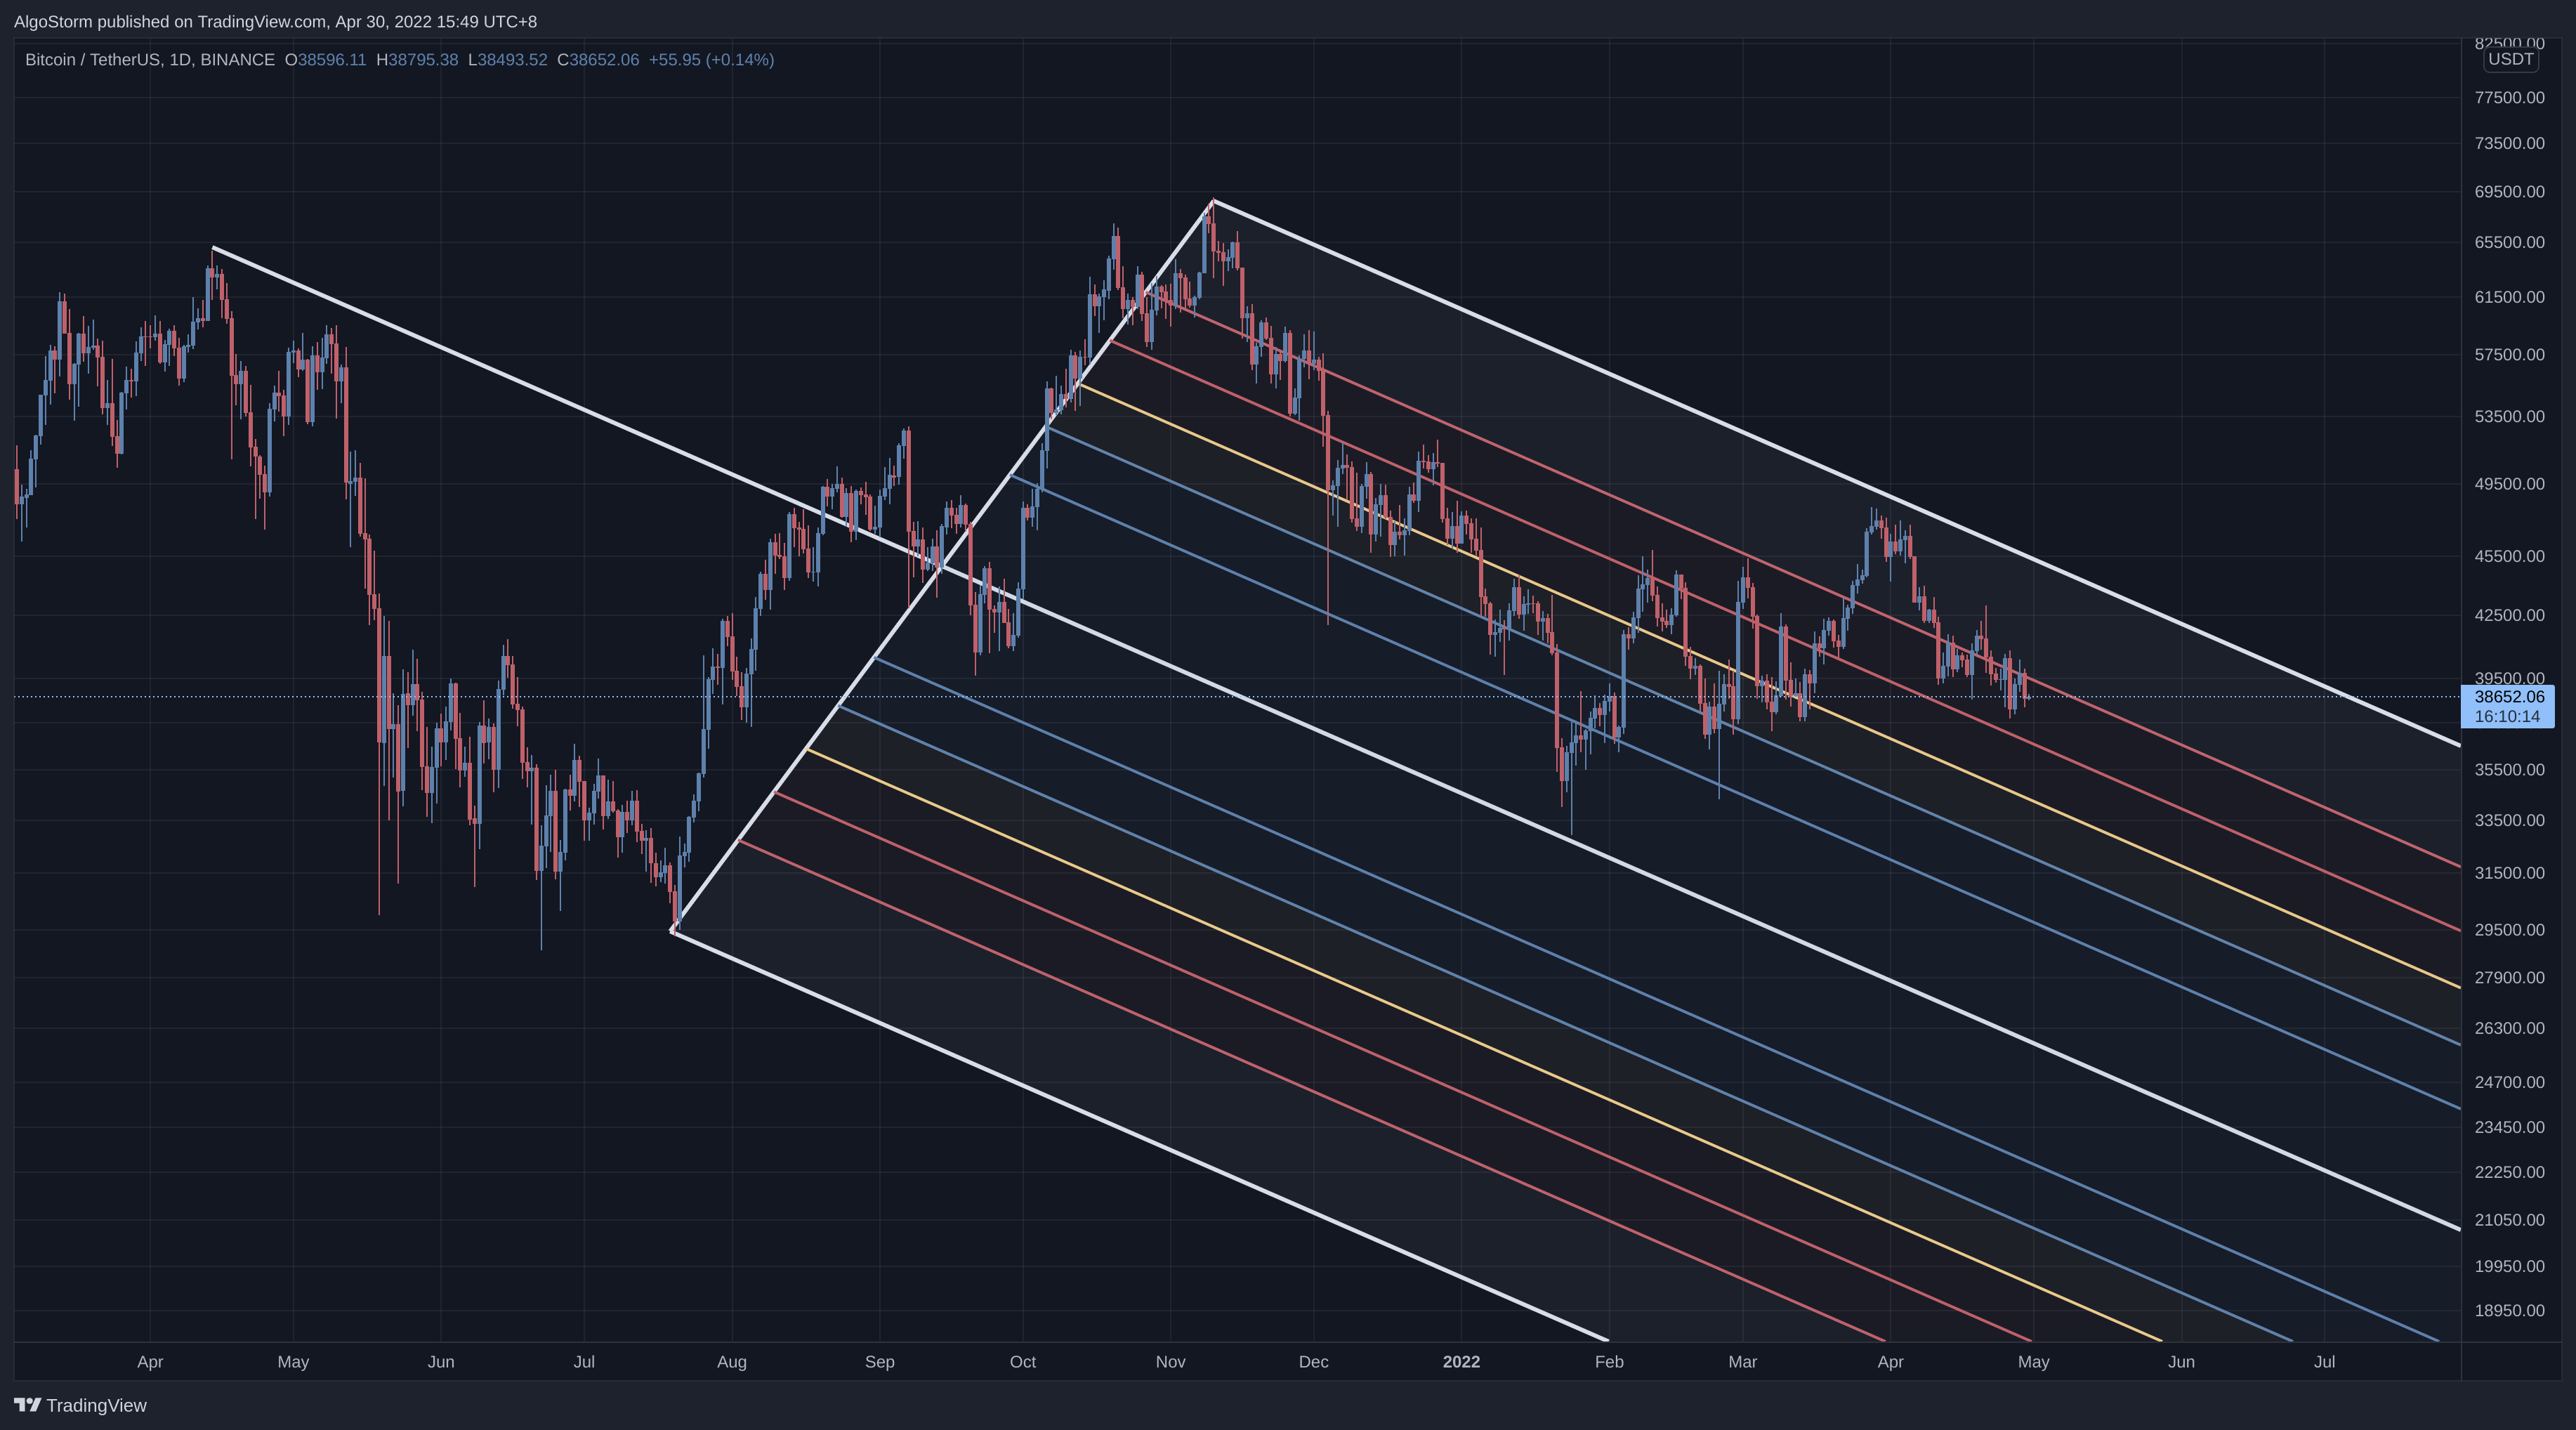
Andrews’ Pitchfork is a technical indicator that uses three parallel trend lines to identify possible levels of support and resistance as well as potential breakout and breakdown levels.
It is created by placing three points at the end of previous trends and then drawing a line from the first point that runs through the midpoint of the other two points.
The reason this indicator is called a "pitchfork" becomes apparent from the shape that is created in the chart.
Important Points To Remember
- Andrews’ pitchfork is a method that uses a series of three trendlines to identify trends and reversals.
- Higher and lower trend lines denote support and resistance.
- Andrews’ Pitchfork can provide momentum traders with signals in the long- or intermediate-term, where it is most useful in predicting more protracted market swings.
- There are four main types of Andrews’ Pitchfork. Namely, the Original Pitchfork, Schiff Pitchfork, Modified Schiff Pitchfork, and the Inside Pitchfork.
- It is recommended to always confirm pitchfork breakouts and breakdowns with other technical indicators.
Andrews’ Pitchfork Overview
This technical indicator (sometimes referred to as "median line studies"), was developed by Alan Andrews. It uses trend lines that are created by selecting three points at the start of confirmed trends, higher or lower.
This is achieved by placing the points at three consecutive peaks and troughs. Once the points are in place, a straight line that denotes the “median line” is drawn from the first point through the midpoint between the upper and lower points. Upper and lower trend lines are then drawn parallel to the median line.
Andrews’ Pitchfork also uses trigger lines, which are trend lines that originate from point one (median line inception price) and intersect with the other points. A lower trigger line connects points one and three, sloping upward on a rising pitchfork. An upper trigger line joins points one and two, sloping downward on a falling pitchfork. Trading signals generated by the trigger lines typically occur well after price breaks the pitchfork’s upper or lower trend line. Breakouts above the upper trigger line suggest further upside, while breakdowns below the lower trigger line predict further downside.
Andrews’ Pitchfork can be easily applied to price charts without a specialized drawing tool. It is also available as a drawing tool in all trading platforms.
Illustration Of Andrews’ Pitchfork:

How To Use Andrews’ Pitchfork?
In general, traders will purchase the asset when the price falls near the support of either the center trendline or the lowest trendline. Conversely, they’ll sell the asset when it approaches the resistance of either the centerline or the highest trendline. Even though the centerline can be used to identify areas where a security may find support or resistance, it is generally not as strong as the two outside lines. In practice, the levels identified by this indicator are very useful for identifying strategic positions for stop-loss orders.
Using Andrews’ Pitchfork As Support and Resistance (Trading Ranges):
Traders could enter a long position when the price of a security reaches the bottom trend line of the indicator. Conversely, a short position might be undertaken when the price hits the upper trend line. Traders may consider booking partial or all profits when the security’s price reaches the opposite side of the pitchfork. Before entering a position, traders should ensure that support and resistance are stalling at these levels. Price should reach the median trend line frequently when a security is trending and, when that doesn’t happen, it may indicate an acceleration in the trend.
Andrews’ Pitchfork can also be used to trade breakouts above the upper trend line and breakdowns below the lower trend line. Traders using this bilateral strategy should be cautious of head fakes and look at other indicators to gauge the strength or weakness of the breakout or breakdown.
Limitations of Using Andrews’ Pitchfork
Keep in mind that selecting the most reliable three points takes skill and experience, which is vital because the indicator’s effectiveness depends on those points. Traders and investors can optimize this task by experimenting with different reactionary highs and lows, constructing and reconstructing the indicator to identify the most effective price points.
Moving Averages
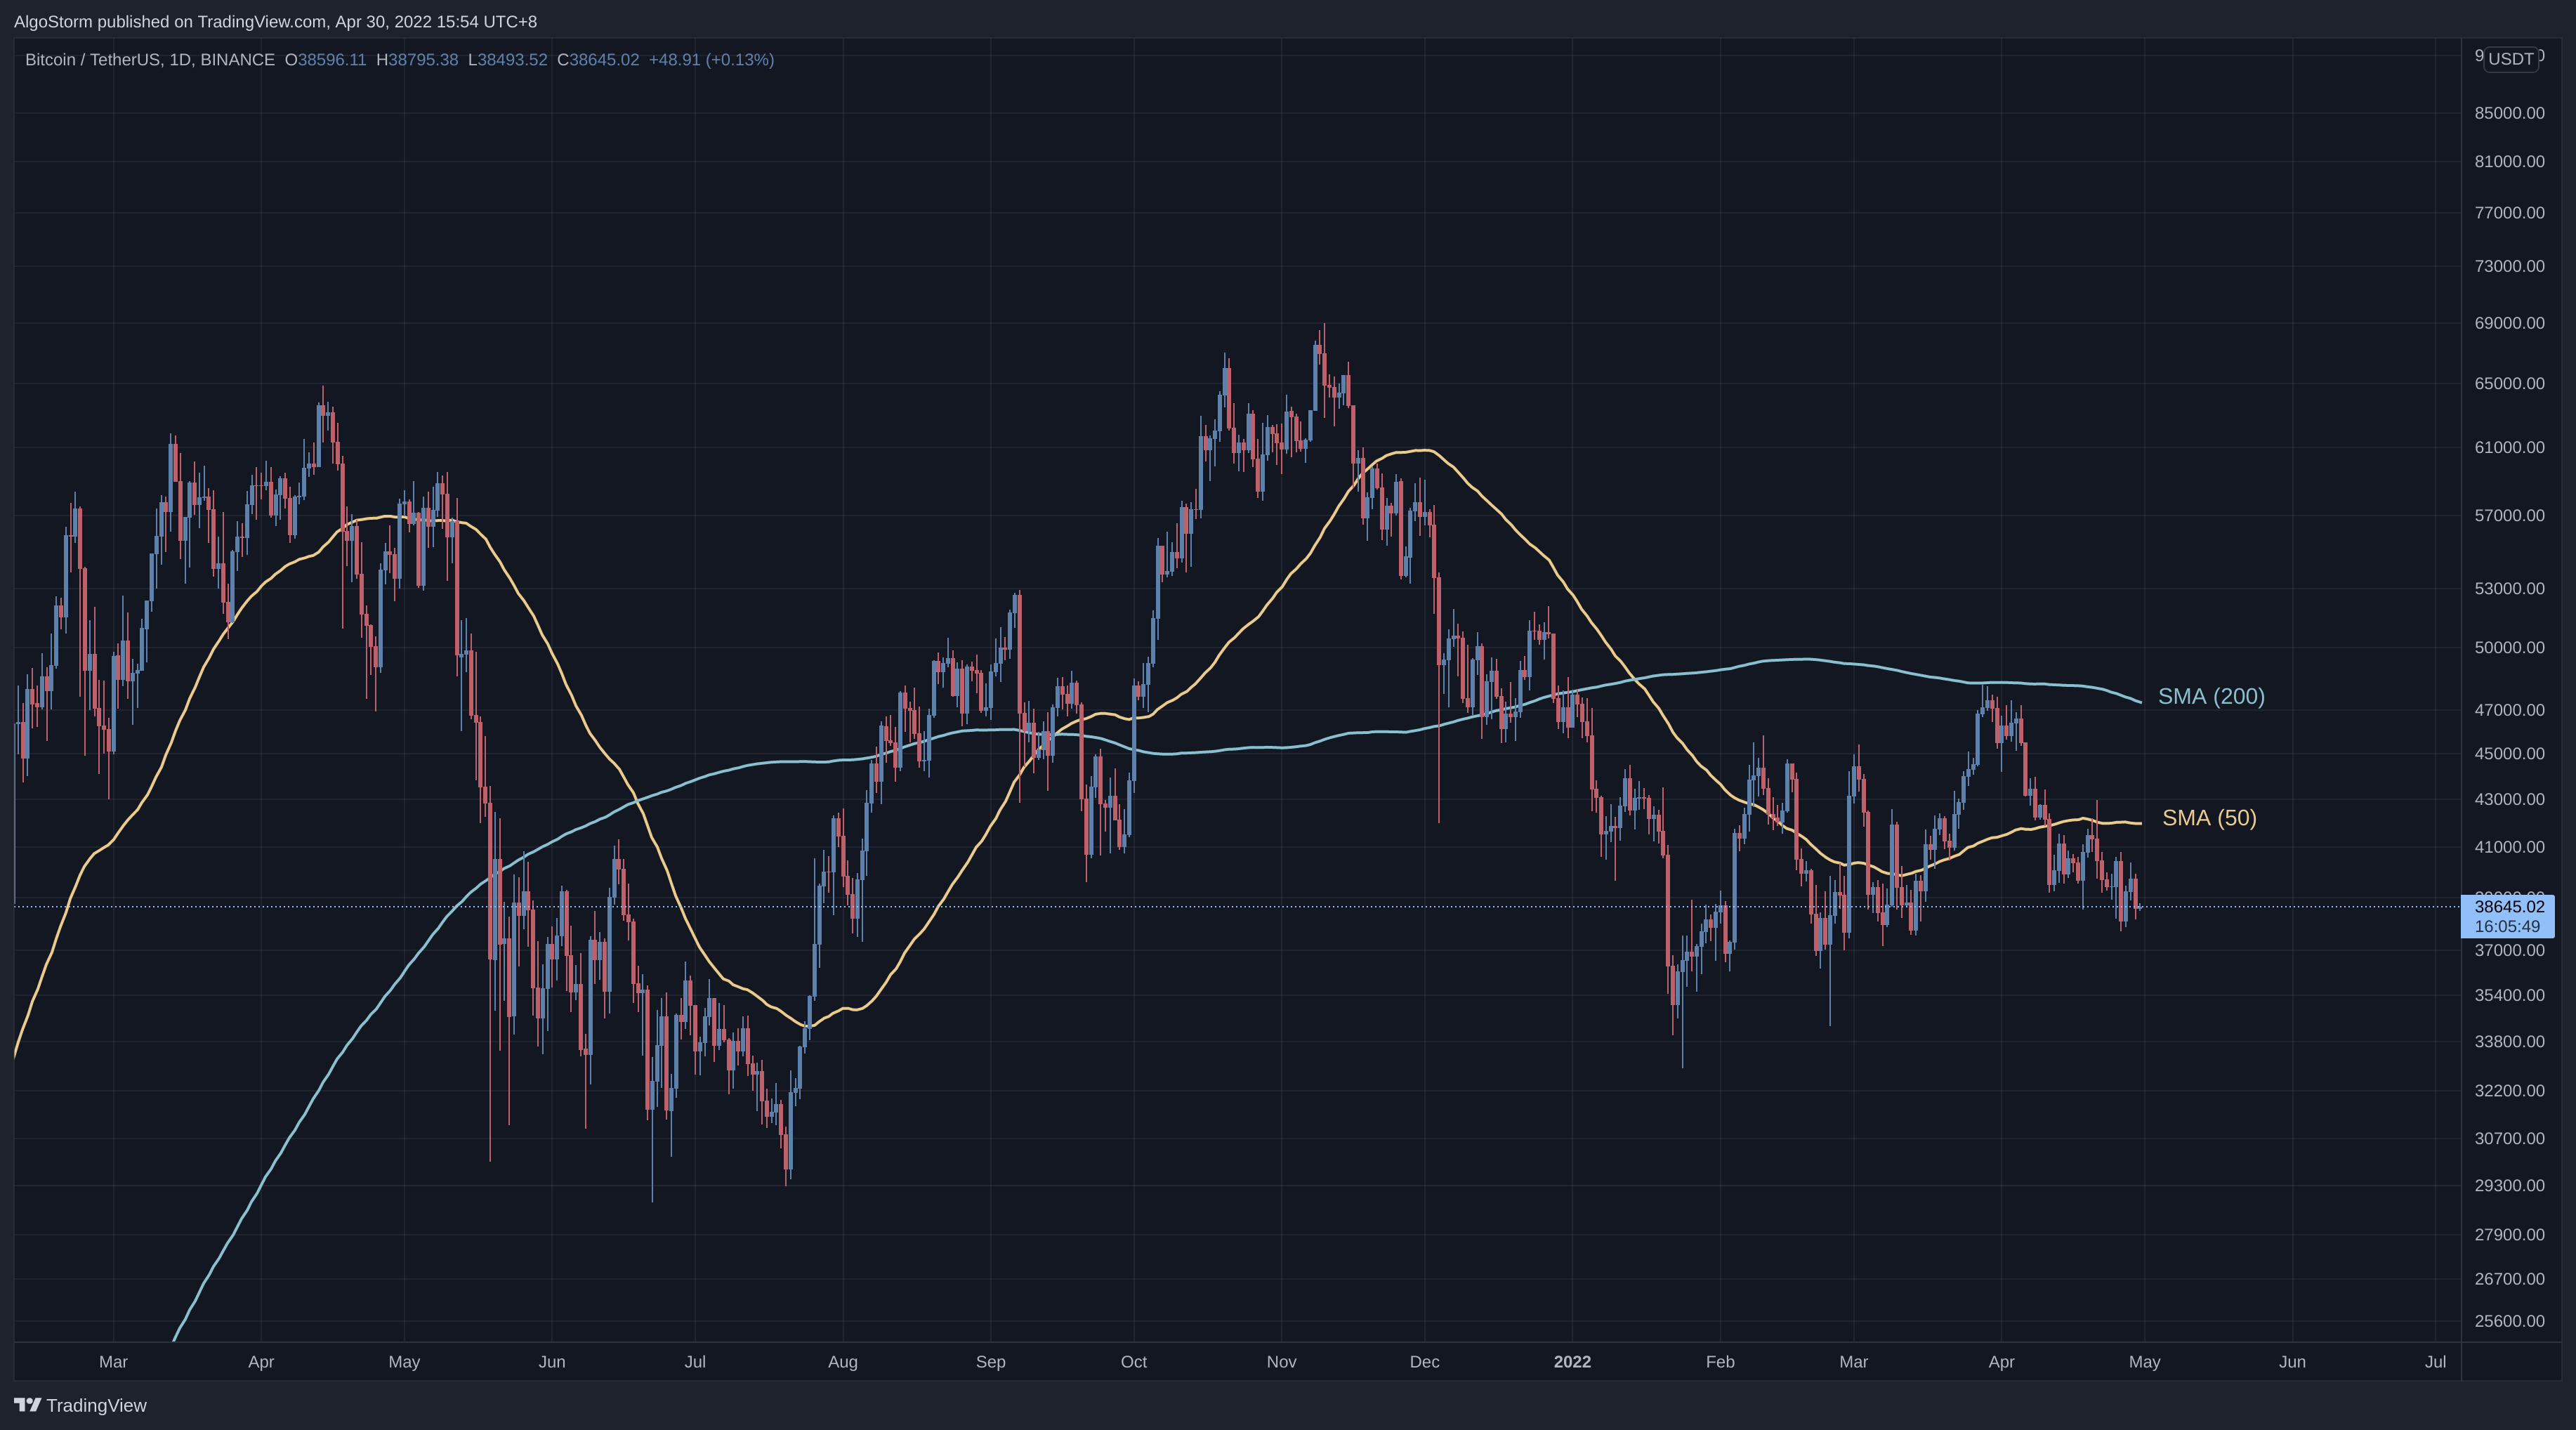
Most technical traders incorporate the power of various technical indicators, such as moving averages, to aid in predicting future short-term momentum, but these traders never fully realize the ability these tools have for identifying levels of support and resistance. As you can see from the chart below, a moving average is a constantly changing line that smooths out past price data while also allowing the trader to identify support and resistance. Notice how the price of the asset finds support at the moving average when the trend is up, and how it acts as resistance when the trend is down.
Traders can use moving averages in a variety of ways, such as to anticipate moves to the upside when price lines cross above a key moving average, or to exit trades when the price drops below a moving average. Regardless of how the moving average is used, it often creates "automatic" support and resistance levels. Most traders will experiment with different time periods in their moving averages so that they can find the one that works best for this specific task.
Illustration Of Moving Averages:

Popular Moving Average Types
There are many different types of moving averages and listing them here is not possible. We will only list the most popular ones.
- Simple Moving Average (SMA): Simple Moving Average is an unweighted Moving Average. This means that each day in the data set has equal importance and is weighted equally. As each new day ends, the oldest data point is dropped and the newest one is added to the beginning.
- Exponential Moving Average (EMA): The Exponential Moving Average (EMA) is a specific type of moving average that points towards the importance of the most recent data and information from the market. The Exponential Moving Average is just like it’s name says – it’s exponential, weighting the most recent prices more than the less recent prices. The EMA can be compared and contrasted with the simple moving average.
- Smoothed Moving Average (SMMA): The Smoothed Moving Average compares recent prices to historical ones and makes sure they are weighed and considered equally. The calculation of this indicator does not reference a specific or fixed period, rather uses all available data in the series for analysis. The Smoothed Moving Average differs from the Exponential Moving Average (EMA) because it’s generally used with a longer time period.
- Weighted Moving Average (WMA): Weighted Moving Averages (WMAs) were developed to expand upon traditional Moving Averages and Exponential Moving Averages. By adding more weight to the most recent price data of Moving Averages (MAs), Weighted Moving Averages are used to weight specific time periods in it calculation more than other time periods.
- Volume-Weighted Moving Average (VWMA): It is similar to the simple moving average but it takes price and volume into account. It is useful for tracking price-volume, identifying trends, and looking at weighted volume over any period of time.
- Hull Moving Average (HMA): It was developed and first introduced by Alan Hull as a new moving average that focuses on smoothness, efficiency, and lag elimination.
- Arnaud Legoux Moving Average (ALMA): It is different from other moving averages because of its specific design to use Gaussian distribution that is shifted with a calculated offset in order for the average to be biased towards more recent days, instead of more evenly centered on the window.
Popular Moving Average Periods
- Popular Fibonacci Periods: 8, 13, 21, 34, 55, 144, 233
- Popular Traditional Periods: 10, 20, 50, 100, 200
Note 1: The 20, 50, and 200 are the most popular periods.
Note 2: The SMA and the EMA are the most popular types.
Fibonacci Retracements
What Are Fibonacci Retracement Levels?
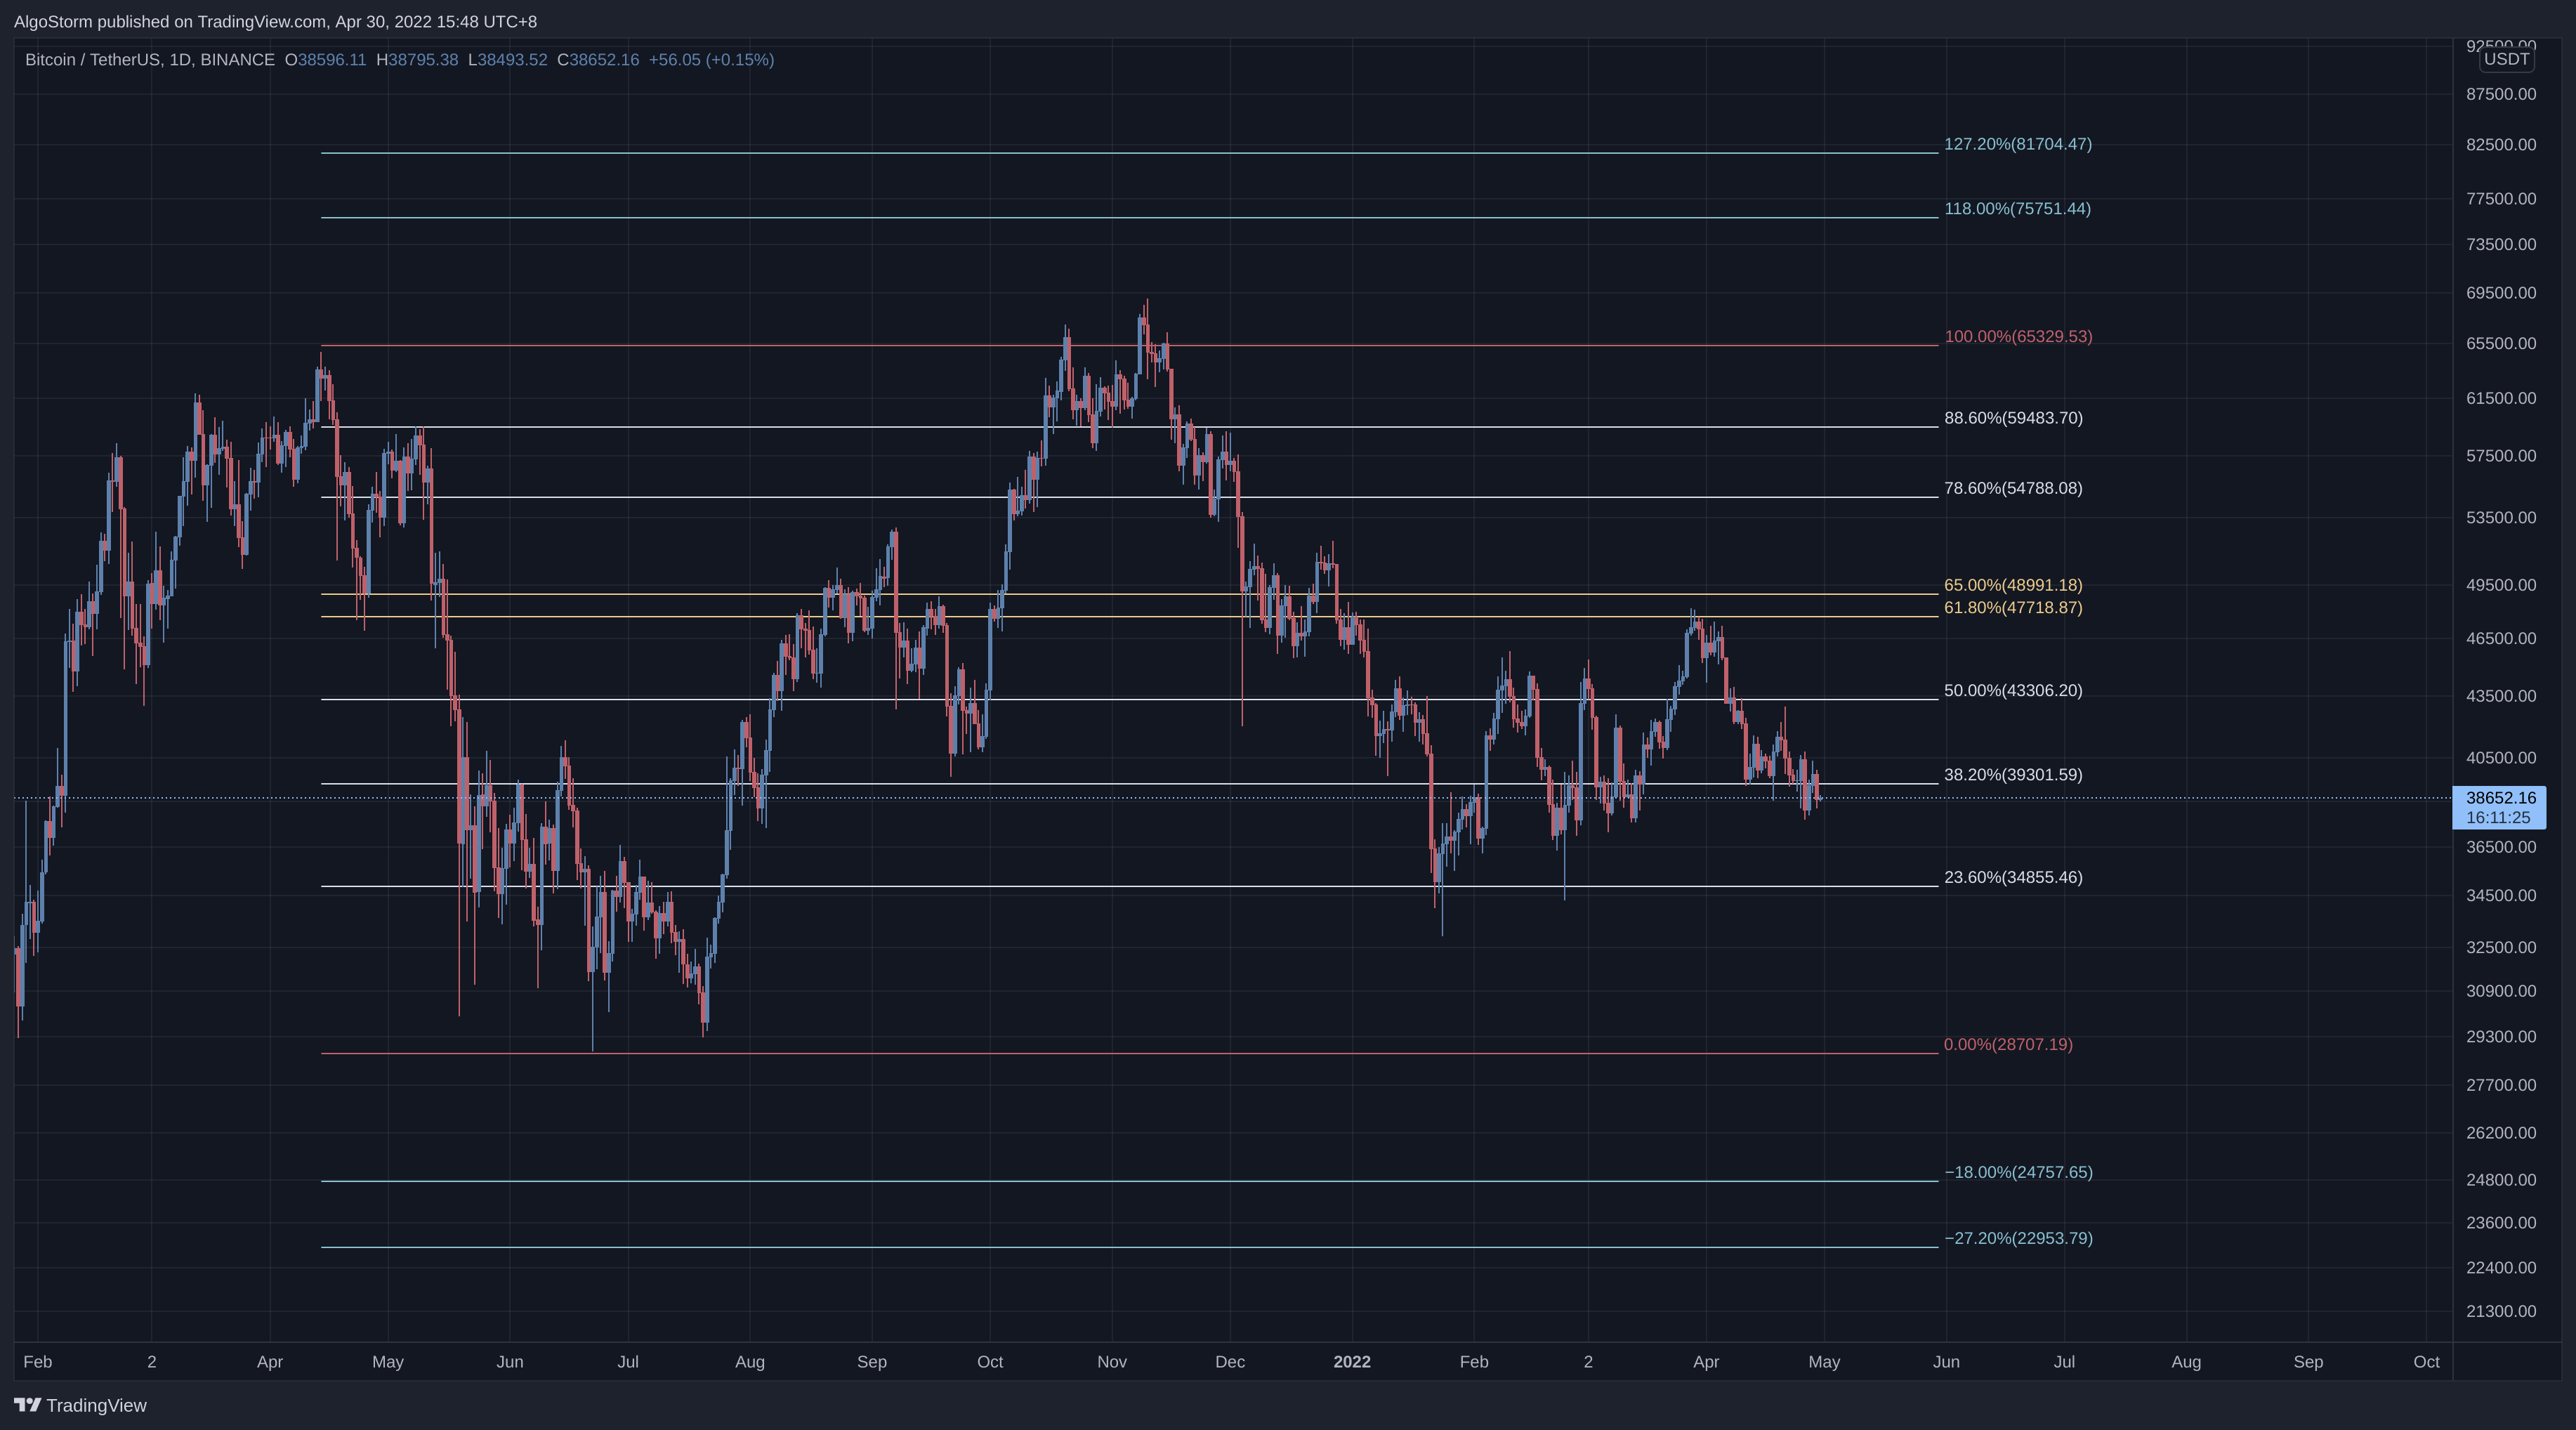
Fibonacci retracement levels—stemming from the Fibonacci sequence—are horizontal lines that indicate where support and resistance are likely to occur.
Each level is associated with a percentage. The percentage is how much of a prior move the price has retraced. The Fibonacci retracement levels are 23.6%, 38.2%, 61.8%, and 78.6%. While not officially a Fibonacci ratio, 50% is also used.
The indicator is useful because it can be drawn between any two significant price points, such as a high and a low. The indicator will then create the levels between those two points.
It is good to note that Fibonacci numbers are found throughout nature, architecture, art, and mathematics, and many traders believe that these numbers also have relevance in the financial markets.
Illustration Of Fibonacci Retracements:

How To Use Fibonacci Retracement Levels?
- Identify Significant Points: To apply Fibonacci levels to your charts, you need to identify Swing High and Swing Low points.
- Draw the Levels: Draw horizontal lines to intersect the trend at the key Fibonacci levels before the price continues the original trend direction.
- Use as Support/Resistance: These levels are best used to identify potential reversal levels. If the price is on an uptrend and you notice that it’s retracing to one of these levels, you could use this as an opportunity to buy.
- Combine with Other Indicators: Fibonacci retracement levels often become more effective when combined with other indicators or technical signals.
Limitations of Fibonacci Retracements
Fibonacci retracement levels are not foolproof. They provide guidance but aren’t a guarantee of success. Other strategies and information should be used to validate trading decisions.
Conclusion
Support and resistance lines are essential tools in technical analysis, providing insight into potential future price movements. These lines can be identified using various methods, including horizontal lines, trendlines, pitchforks, moving averages, and Fibonacci retracements.
Understanding how to properly utilize these tools can enhance trading strategies and increase the probability of success in the market. However, it’s essential to recognize that no single tool or method is foolproof. Combining these tools with other indicators and a solid understanding of market dynamics will provide the best results.
Always remember that trading involves risks, and it’s wise to consult with a financial professional or conduct thorough research before making trading decisions.
