Divergences
Divergence Definition
Divergence is when the price of an asset is moving in the opposite direction of a technical indicator, such as an oscillator, or is moving contrary to other data. Divergence serves as a warning that the current price trend may be weakening, and in some instances, may lead to the price changing direction. Divergence can occur between the price of an asset and almost any technical or fundamental indicator or data.
In technical analysis, divergence is a potent indicator that can signal a significant upward or downward shift in an asset’s price. Traders employ this method to evaluate the underlying momentum of an asset’s price, providing insights into the potential for a future reversal.
Divergence analysis involves comparing price action with momentum indicators, identifying instances where price trends and momentum indicators move in opposite directions. This contrast often suggests that the current price trend may be weakening and could be approaching a pivotal turning point, making it a valuable tool for forecasting potential changes in market direction.
Main Types of Divergence
Bullish Divergence

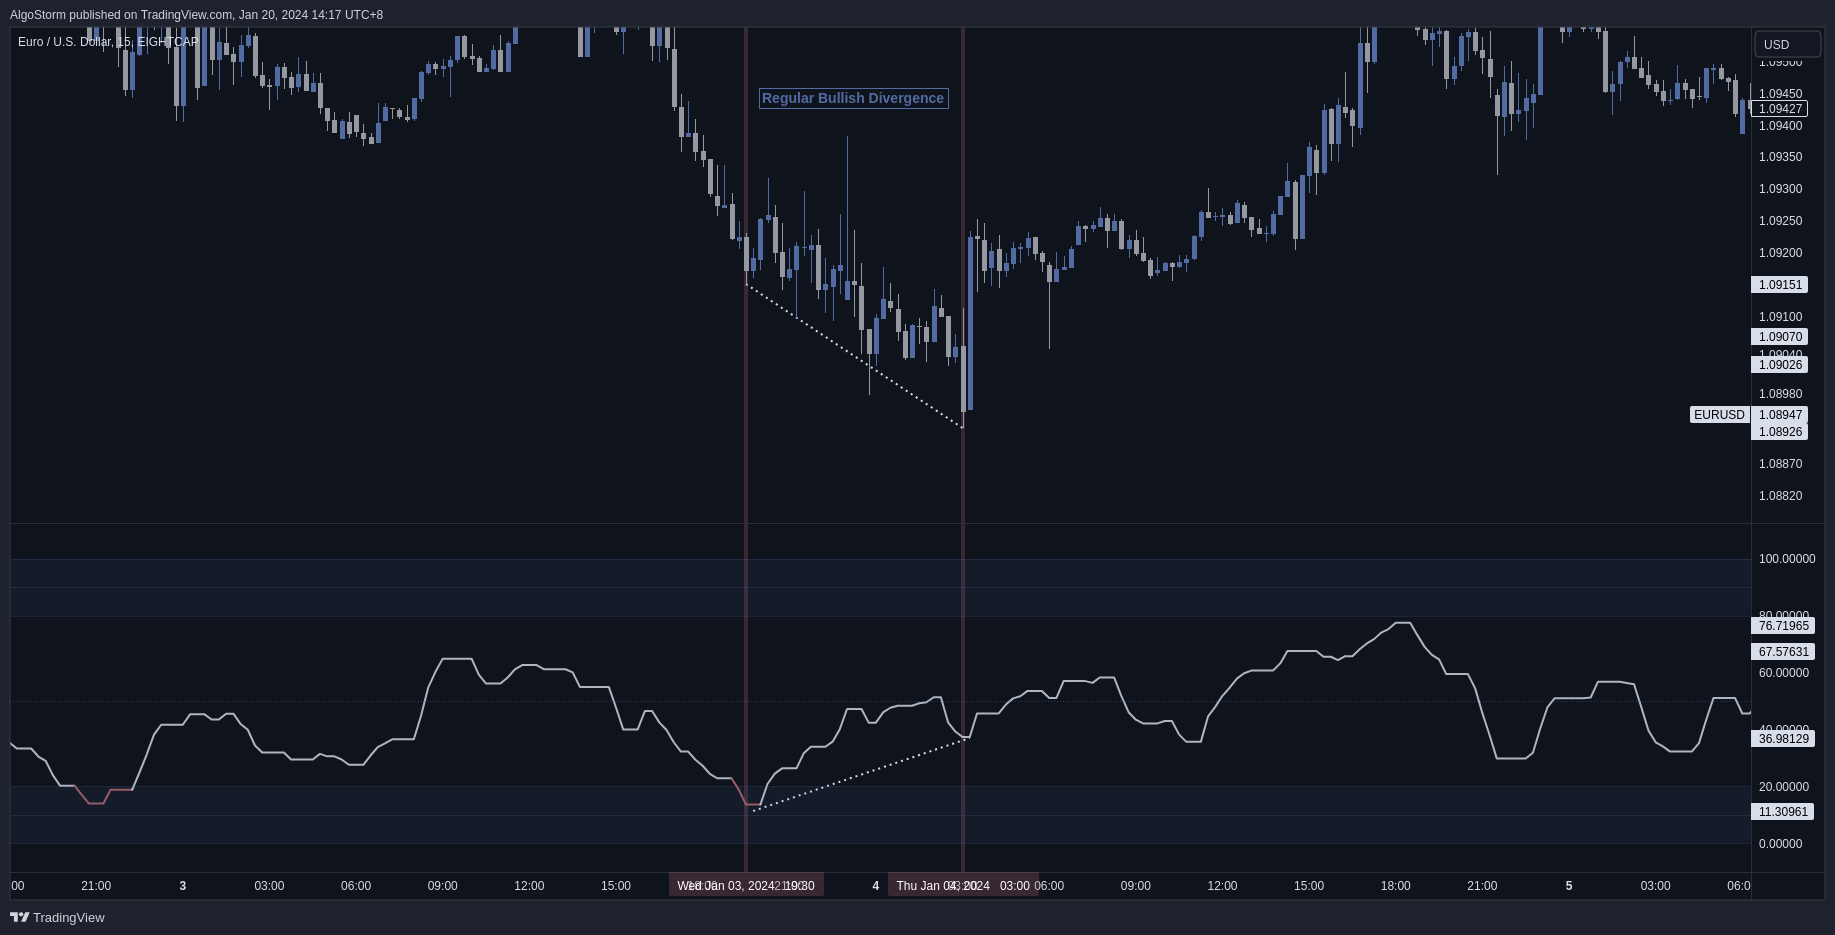
Bullish Divergence signals that the price could start moving higher soon. It occurs when the price is moving lower but a technical indicator is moving higher or showing bullish signals.
Bearish Divergence

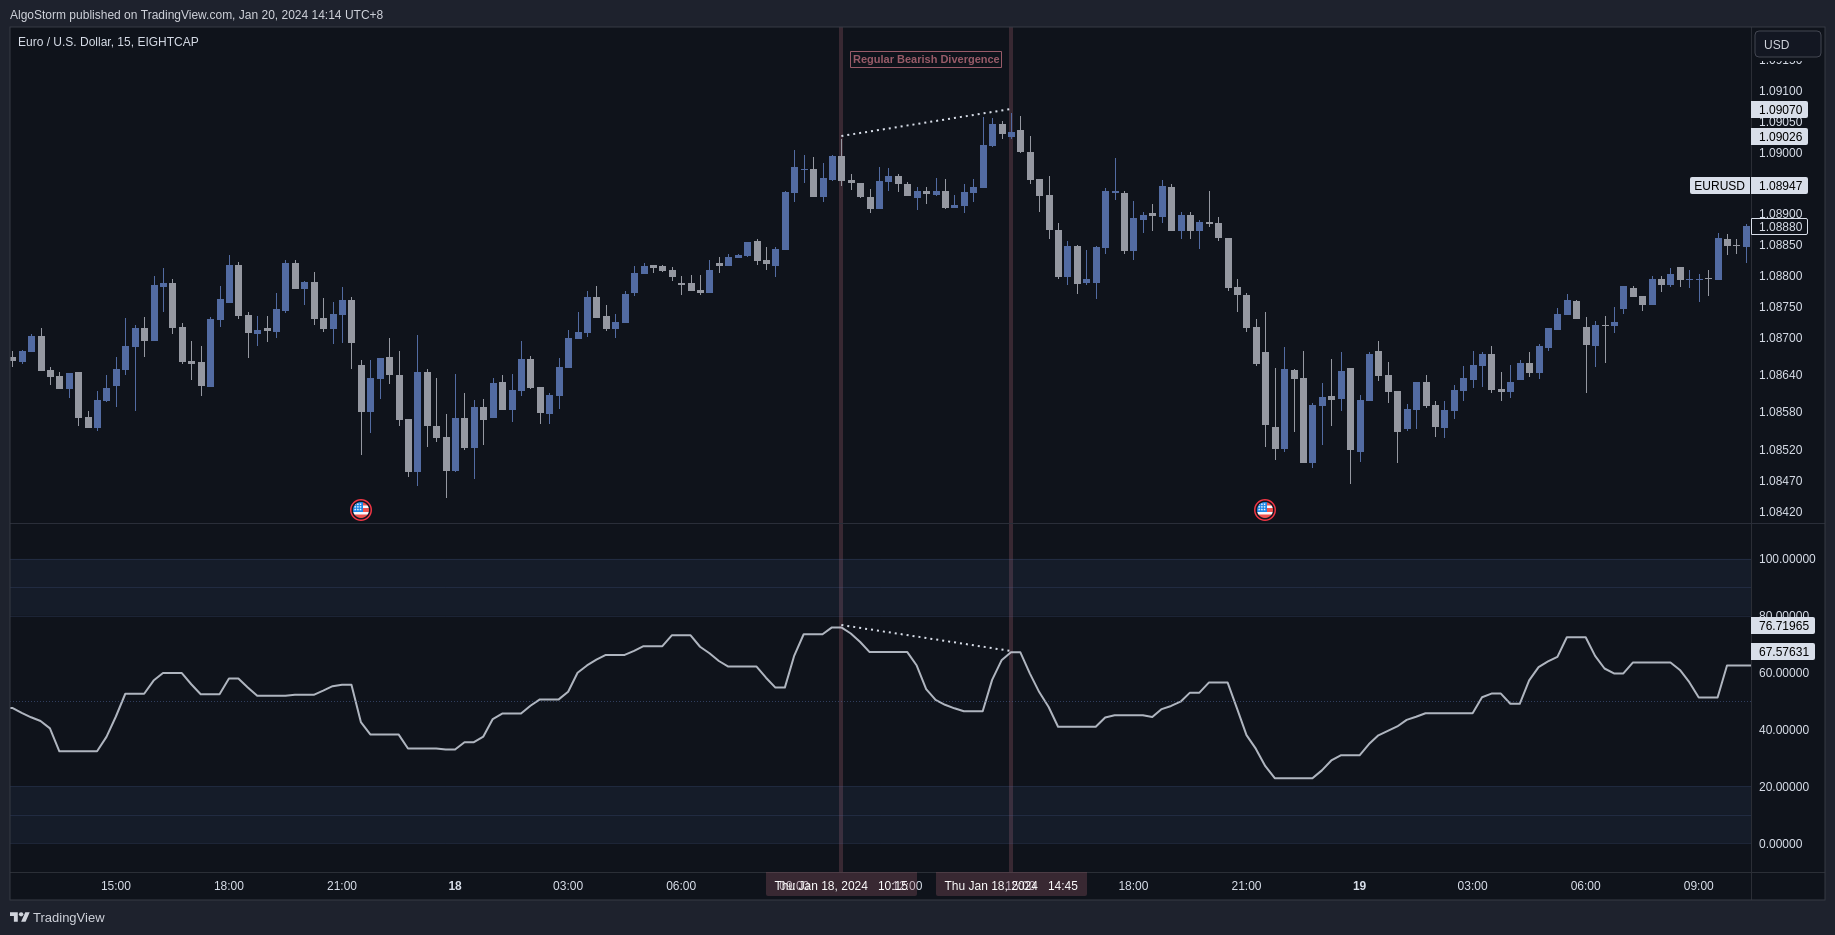
Bearish Divergence suggests that lower prices are on the horizon. It happens when the price is moving higher but a technical indicator is moving lower or showing bearish signals.
Regular Bullish and Bearish Divergence
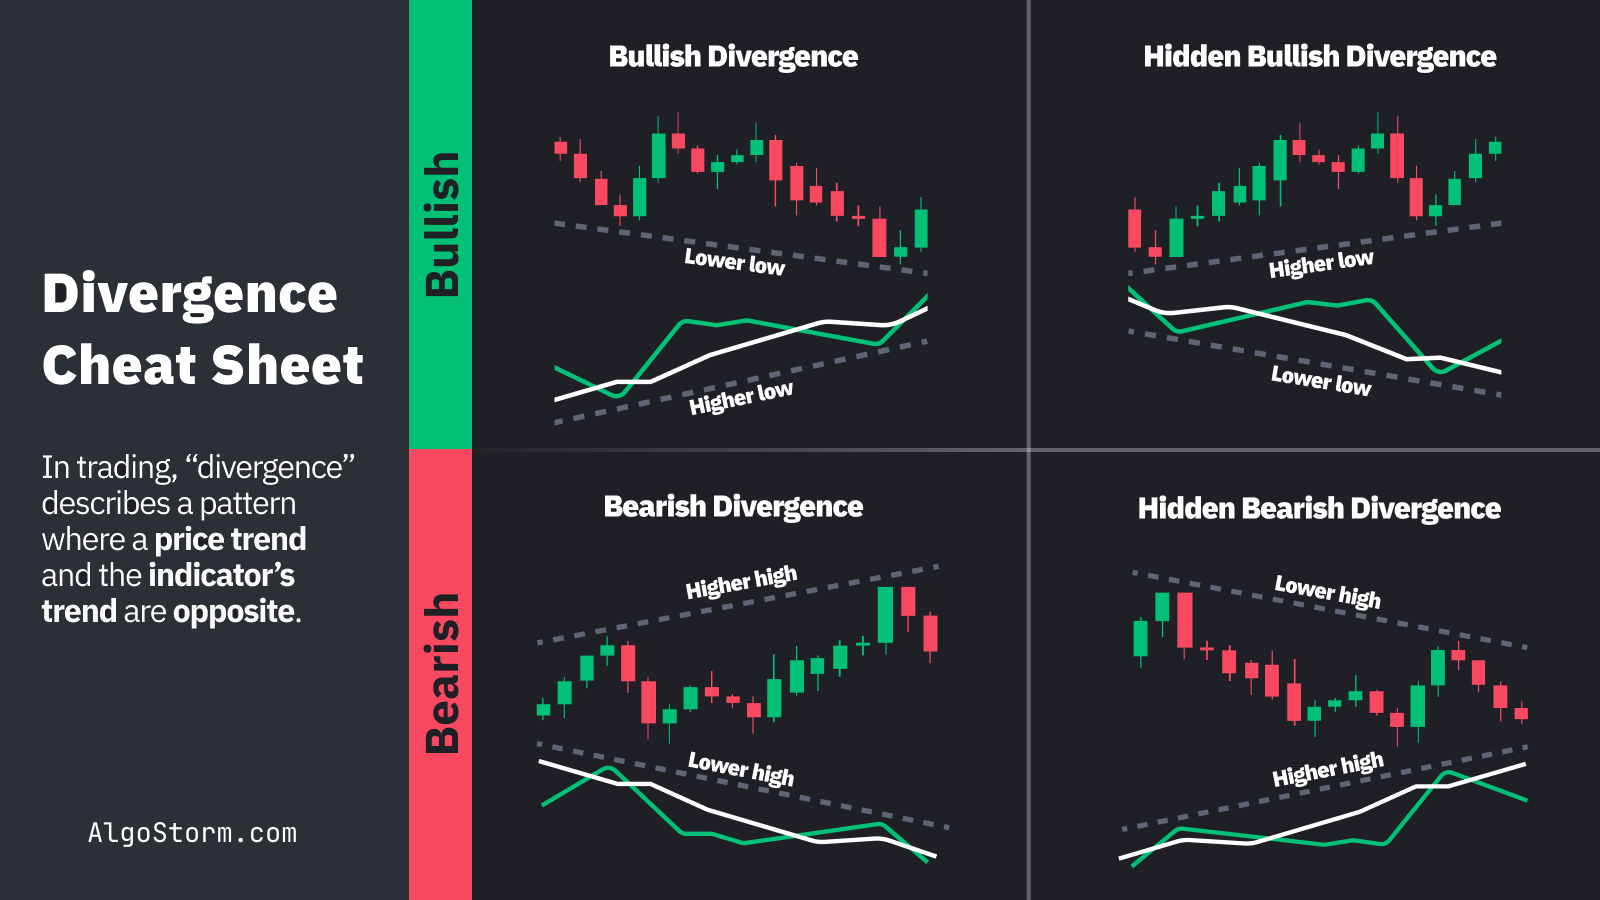
Regular Bullish Divergence occurs in a downtrend when the price action prints lower lows that are not confirmed by the oscillating indicator. Regular Bearish Divergence happens in an uptrend when the price action makes higher highs that are not confirmed by the oscillating indicator.
Hidden Bullish and Bearish Divergence
Hidden Bullish Divergence happens during a correction in an uptrend when the oscillator makes a higher high while the price action does not. Hidden Bearish Divergence occurs during a reaction in a downtrend when the oscillator makes a lower low while the price action does not.
Double Divergences
Double Divergence is a more potent form of divergence that reinforces the signals given by a single divergence. In this case, two divergent points are observed within a relatively short timeframe. For instance, if the price makes a new low, rebounds, and then makes another new low—while the technical indicator makes a low, a higher low, and then another higher low—this would be considered a Double Bullish Divergence.
Double Bullish Divergence Example
Consider a scenario where a stock’s price makes two consecutive lower lows over a month, but the RSI makes two consecutive higher lows during the same period. This could be a very strong indicator of a forthcoming bullish reversal.
Double Bearish Divergence Example
Conversely, if a stock’s price makes two higher highs but the MACD makes two lower highs, this would indicate a Double Bearish Divergence, and could serve as a robust warning of an impending downtrend.
Divergences Cheat Sheet

Indicators For Divergence Analysis
Popular indicators used in divergence analysis are essential tools for traders seeking to identify potential reversals in market trends. These indicators compare price action with various momentum measurements to spot inconsistencies, which can signal upcoming changes in the asset’s direction. Some of the most widely used indicators for divergence analysis include:
Relative Strength Index (RSI): A momentum oscillator that measures the speed and change of price movements. RSI divergence occurs when the price forms a new high or low that is not mirrored in the RSI, indicating a weakening trend.
Moving Average Convergence Divergence (MACD): This indicator shows the relationship between two moving averages of a security’s price. Divergence with MACD happens when the price diverges from the MACD, signaling a potential reversal.
Stochastic Oscillator: This momentum indicator compares a particular closing price of an asset to a range of its prices over a certain period. Stochastic divergence can be a powerful signal, especially when the price reaches a new high or low that is not supported by the stochastic indicator.
Money Flow Index (MFI): This indicator incorporates both price and volume data to identify overbought or oversold conditions. Divergence in MFI can indicate potential reversals when price trends and the MFI trajectory do not align.
Commodity Channel Index (CCI): Originally designed for commodities, it can also be used for stocks or indices. CCI divergence occurs when the price makes new highs or lows that are not confirmed by the CCI.
On-Balance Volume (OBV): This indicator uses volume flow to predict changes in stock price. Divergence with OBV can be a leading indicator of price reversals, particularly in strongly trending markets.
AlgoStorm Momentum Oscillator (AMO): The AlgoStorm Momentum Oscillator (AMO) is one of our premium indicators that combines the features of both a trend and a momentum oscillator. This innovative indicator is adept at providing clear insights into the market’s strength or weakness, while also confirming ongoing trends and signaling potential reversals. Learn more about our premium indicators at: https://algostorm.com/trading-indicators/
The Difference Between Divergence and Confirmation
Divergence is when the price and indicator are telling the trader different things. Confirmation is when the indicator and price, or multiple indicators, are telling the trader the same thing.
Limitations of Using Divergence
While divergence can be a valuable tool, it is essential to understand that it should not be relied upon solely. Investors should use a combination of indicators and analysis techniques to confirm a trend reversal before acting on divergence alone. Moreover, divergence will not be present for all price reversals, and even when it does occur, it doesn’t guarantee a price reversal or that a reversal will occur soon.
Practical Applications and Examples
Trading Strategies
Divergence can be incorporated into various trading strategies to identify potential entry and exit points. It can also aid in risk management by offering early warnings about potential reversals in price trends.
Examples
For instance, if a stock’s price is in a downtrend making lower lows, but the RSI is making higher lows, this could signify a bullish divergence and a potential buying opportunity. Conversely, if a stock’s price is in an uptrend making higher highs but the MACD is making lower highs, this might indicate a bearish divergence and could be a signal to sell.
Advanced Insights
Convergence
The opposite of divergence is convergence, where the price and the indicator move in the same direction, affirming the current trend.
False Signals
Divergence can sometimes give off false signals, making it imperative to use it in conjunction with other indicators for validation.
Timeframes
Divergence can be observed across different timeframes, providing valuable insights for both short-term traders and long-term investors.
Conclusion
Divergence is a powerful tool in the toolbox of technical analysis, offering valuable insights into potential trend reversals or continuations. By understanding and effectively employing divergence—be it regular, hidden, double, or implied—traders and investors can make more informed decisions, thus enhancing their trading strategies. However, as with any tool, it’s crucial to use divergence wisely, in concert with other indicators, and as part of a comprehensive trading plan.